Users: HeadsUWin_TailsILose: All Pages
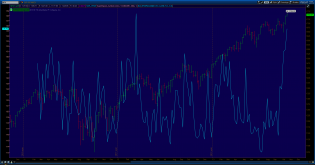
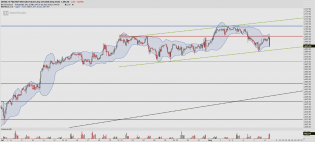
NYHL_09.13.2014.png
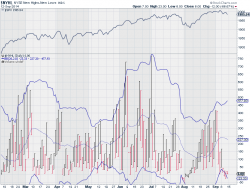
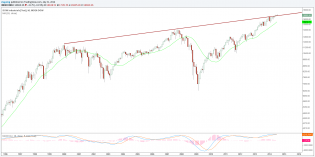
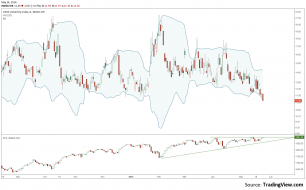
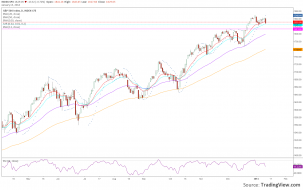
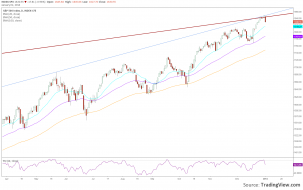
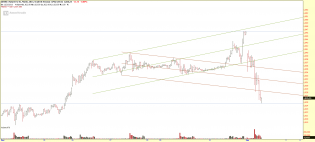
NYSE new highs/lows near the extreme bottom seen during early August pullback. Does this mean big upside soon? Any...

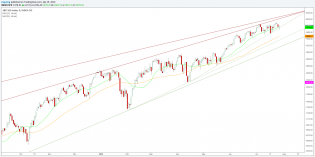
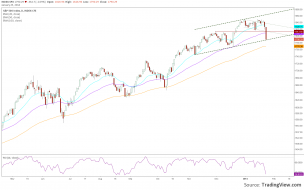
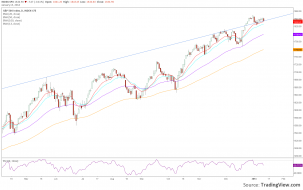
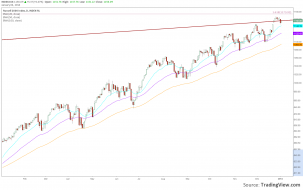
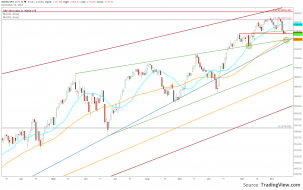
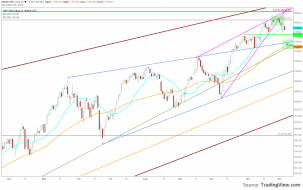
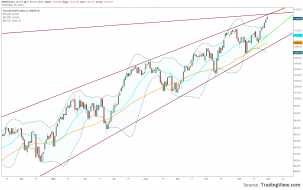
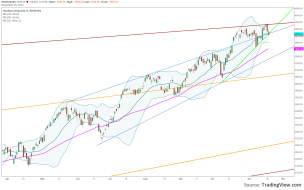
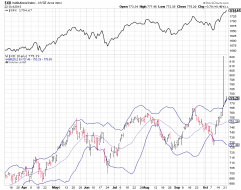
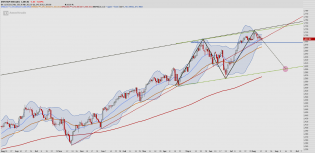
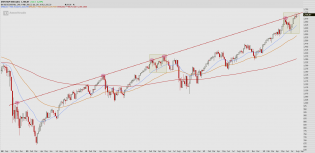
spx_daily_09.13.2014.png
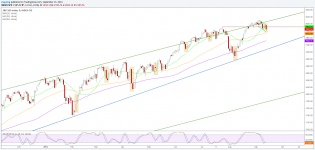
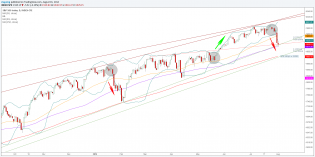
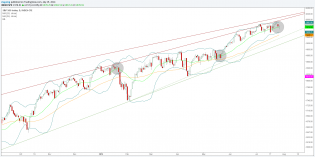
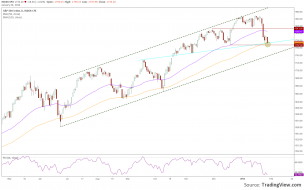
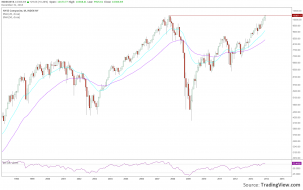
SPX daily showing pullback from top of the channel and also has highlighted Thur/Fri prior to opex. Seems to be bu...
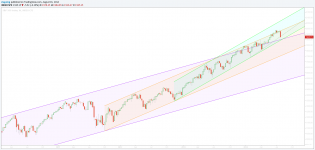
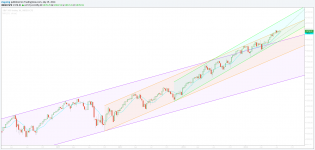
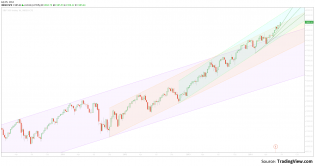
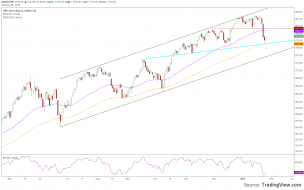
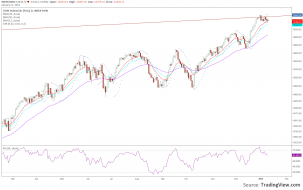
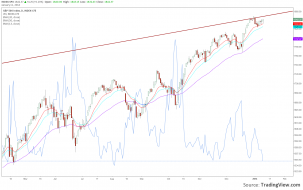
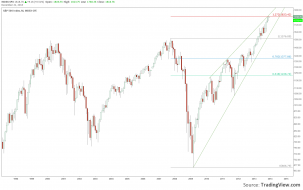
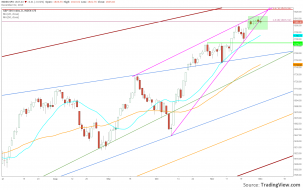
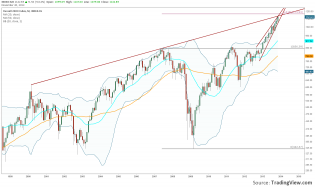
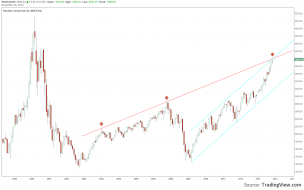
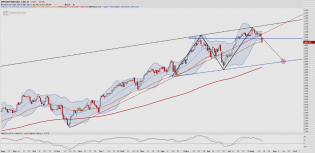
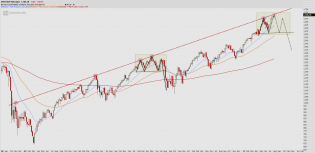
spx_wkly_09.13.2014.png
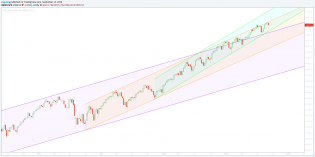
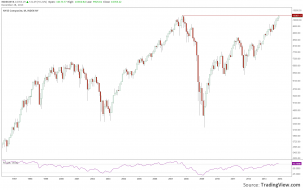
SPX weekly just pulling back slightly from the top of the middle channel formed in Oct 2012.
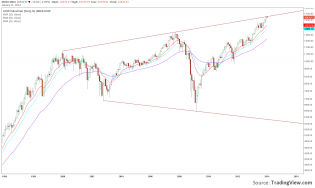
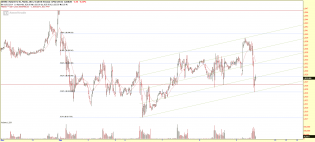
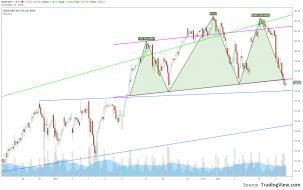
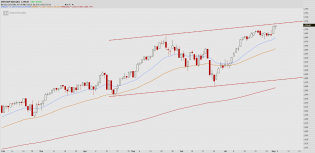
spx_opex.png
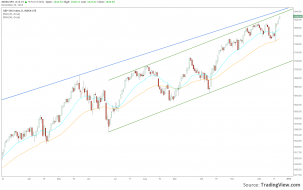
Thu/Fri of the week prior to SPX opex appeared to mark a low in 5 of 7 most recent instances.
3
spx_08012014.png
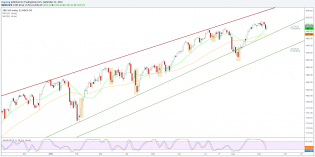
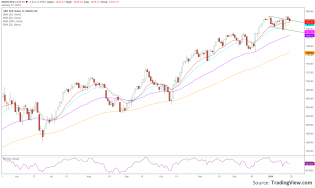
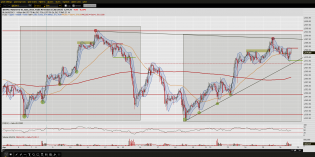
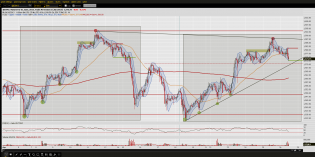
SPX daily broke down thru 50MA and lower BB. Bounced off the 89MA today and sitting at trendline from 10/2011. NYM...
1
spxWk_08012014.png
SPX weekly still holding in the uppermost green channel. But also turning back towards the bottom of its channel w...
dow_07312014.png
I see this DOW monthly chart which on a weekly/daily basis is breaking that trendline.
1
spx_daily_07292014a.png
With the SPX bollinger band compression of ~30 pts, rising VIX, and declining breadth - will it soon break hard do...
3
spx_weekly_07292014.png
SPX weekly holding up - see if it can close below 10MA which hasn't occurred since April.
spx_daily_07292014.png
SPX daily still holding up.
spxWk_07052014.png
SPX weekly - guess there are only blue skies...
1
spx_05242014.png
VIX closed below lower BB and near the 3/2013 low. Only wonder if it continues downward taking SPX to more ATHs, o...
spx_01302014.png
SPX daily - looks like the confluence of 100EMA, prior low (~1768), and blue trendline are providing strong support.
1
spx_01292014.png
SPX daily - not including today's action which also touched the blue trendline. The 100EMA and blue trendline are...
spx_01252014.png
SPX daily closed below 50EMA and sitting just at the bottom of a short term channel/trendline from Nov. Maybe a re...
4
spx_01172014.png
SPX daily bounces off 13EMA but closes back inside the bull flag.
spx_01132014a.png
SPX daily below 13EMA with 20EMA at 1825.77 and prior high of 1813.55 from late November. Also SAR just flipped ne...
1
spx_01132014.png
SPX daily - rebound off the 13EMA as in the prior five instances or finally just a drop?
dowDaily_01112014.png
Just an observation that Dow is the only major index sporting a negative PSAR. Guess this should be an interesting...
dowMonthly_01112014.png
Seems the DOW monthly expanding wedge is holding for now.
2
spx_01112014.png
SPX daily respecting 13 EMA and VIX plummeting.
es_01092014.png
ES channel bounce off lower trendline and 23.6% fib.
2
rut_01042013.png
A 2-3% drop on the RUT/NAS/DOW/SPX gets prices down to ~50 EMAs from which large bounces recently occurred. Note t...
1
spx_01022014.png
SPX daily backing away from intermediate and longer term trendlines. EMAs below if the market downtrend continues.
esh4_01022014.png
ES bounce near 23.6 fib and prior consolidation area.
nya_12312013.png
NYSE just exceeded its all time high today.
nyse_12282013.png
While the Dow, RUT, and SPX have all made new highs, the NYSE is now a few dozen points from reaching its prior 20...
1
spx_12232013.png
SPX continues to track along the top of the channel trendline.
spxfe_12212013.png
Going back to a long term SPX chart, I noticed that the 1.272 fib extension was hit on Friday. Not sure how meaningfu...
1
spx_12132013.png
SPX daily looks to be below a potential HS, but above a support level at 1775.22. Assuming price continues downwar...
2
spyhrly_12122013.png
Wonder if this is a possible SPY H&S pattern that will play out to a downside target of about 175?
spx_12052013.png
SPX closes below 20 day MA.
1
spx_12022013.png
Let's see if the SPX wedge breaks decisively and clears this 6 day consolidation area.
rut_daily.png
RUT daily in close proximity of 2000/2007 and recent weekly trendlines.
rut_monthly.png
RUT monthly near 2000/2007 upper trendline.
2
nasx.png
IF nasdaq closes around here, it will be back underneath the recent trendline break.
nasx.png
With the bullish action across all indices, I noticed a trendline resistance and channel top about to be crossed o...
2
2013-10-24-TOS_CHARTS.png
Not sure of correlation with SPX/Skew - here's 5 year SPX weekly with skew overlay. There was one time in May 2012...
2
spx_xii.png
Updated chart with white background: SPX/XII institutional index.
spx_nyhl.png
Updated chart with white background: SPX/NYHL NYSE highs-lows.
spx_1yeardaily.png
SPX 1 year daily - possibly meandering towards a Sept low. But there's also the gap down from 1684.83 that may loo...
spx_1year.png
SPX one year daily - will it stay above the 20 day ma and uptrend line from 11/16/2012?
es_channel.png
1
spx_6month.png
SPX 6 month/daily channel.
spx_5year.png
SPX 5 year weekly - trendline rejections.
4
spx_5year.png
1
2013-04-26a-PROPHET.png
1
2013-04-26-PROPHET.png
ES April/May mini-analog