Users: Hokie: Short Side Of Long: Weekend Sentiment Summary
Short Side Of Long: Weekend Sentiment Summary
Weekend Sentiment Summary
I was hoping to put this post up a bit earlier, however the allure of NBA play off finals has kept me at bay. The current type of powerful rally is very healthy when seen post major market lows, like in 2003 and 2009. Market tends to rally hard out of extremely oversold and overly pessimistic conditions as it mean reverts to equilibrium (if there is ever such a thing with human emotions involved).
However, the market has entered a blow off terminal phase of the bull market.
The Federal Reserve is now fully aware that they have created yet another bubble.There have been only a handful of rallies with similar vertical gradient over the last two decades, mainly during the tech bubble euphoria of the late 1990s. During periods like these, sentiment becomes almost irrelevant. It doesn't matter really what indicator says what... until one day it does.
On the other side of the spectrum, precious metals bearish sentiment is on a record breaking run. Week after week, we see either lower sentiment surveys or lower positioning via the COT report (especially link to the small speculator space).
Equities
Chart 1: Bears are non existent in the advisor community

Source: Short Side of Long
Investor Intelligence survey levels came in at 52% bulls and 20% bears. Bullish readings rose by 4%, while bearish readings rose by 1%. Raw bullish readings are not yet at extreme levels, however the survey continues to display a non existence in bearish sentiment. While not always perfect, perviously low levels (especially when prolonged) have been signs of intermediate market peaks. Finally, survey's bull ratio, displayed in the chart above, remains in complacency zone (sell signal). Last weeks chart can be seen by clicking here. NAAIM survey levels came in at 79% net long exposure, while the intensity came in at 40%. As already reported last week, net long exposure has averaged at the highest level since the surveys inception. Last weeks chart can be seen by clicking here.Chart 2: Hulbert's Nasdaq sentiment is reflecting euphoria
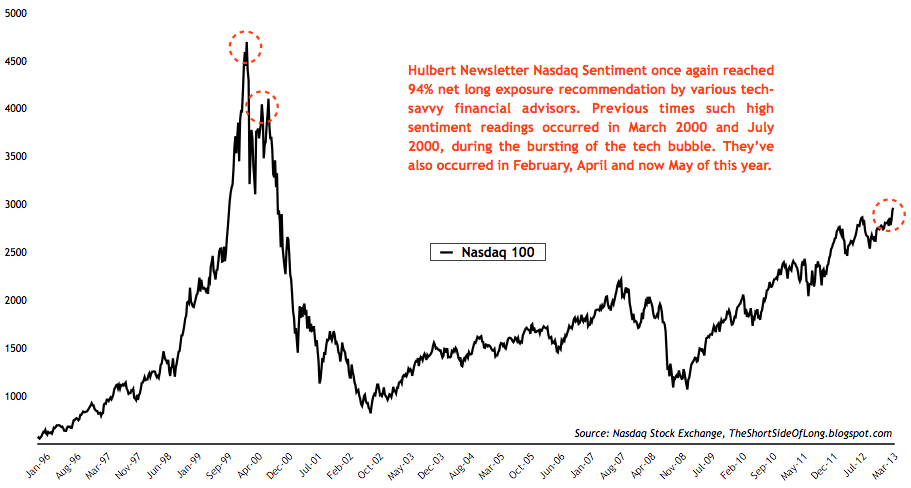
Source: Short Side of Long
Chart 3: Retail investors flock into stocks at the end of a rally

Source: Short Side of Long
Chart 4: Total option positioning remains at neutral levels

Bonds
Chart 5: Newsletter advisors are very bullish on Treasuries
Source: SentimenTrader
Bond sentiment surveys are continuing to recover from their recent troughs. Consensus Inc survey has rebounded from extremely pessimistic levels few weeks ago, towards more neutral levels. Market Vane survey is still in the neutral territory. Hulbert Newsletter Bond survey is approaching extremely high optimistic levels, as can be seen in the chart above. All in all, sentiment on Treasuries isn't overly extreme, but the asset class remains extremely overvalued after a 31 year bull market.Chart 6: Speculators remain quite neutral on Treasuries

Source: Short Side of Long

Source: Short Side of Long
Latest commodity commitment of traders report showed that hedge funds and other speculators hold extremely low exposure towards commodities. Investors held over 1.3 million net long contracts in January 2011, with prices peaking in late April 2011. The twenty four month bear market has reduced those positions to some of the lowest levels since Match 2009, currently at 347,000 net long contracts. Note: My own personal Commodity COT Indicator takes into account various commodity positioning from Energy, Agriculture and Metals sector. It only focuses on COT reports which correlate closely to the price and excludes other which do not.
Source: Short Side of Long

Source: Short Side of Long
Chart 10: Hedge funds still hold elevated bets on the greenback

Source: Short Side of Long
Chart 11: Speculator positioning on the Pound is extremely low

Chart 12: Small speculators are extremely negative on Silver
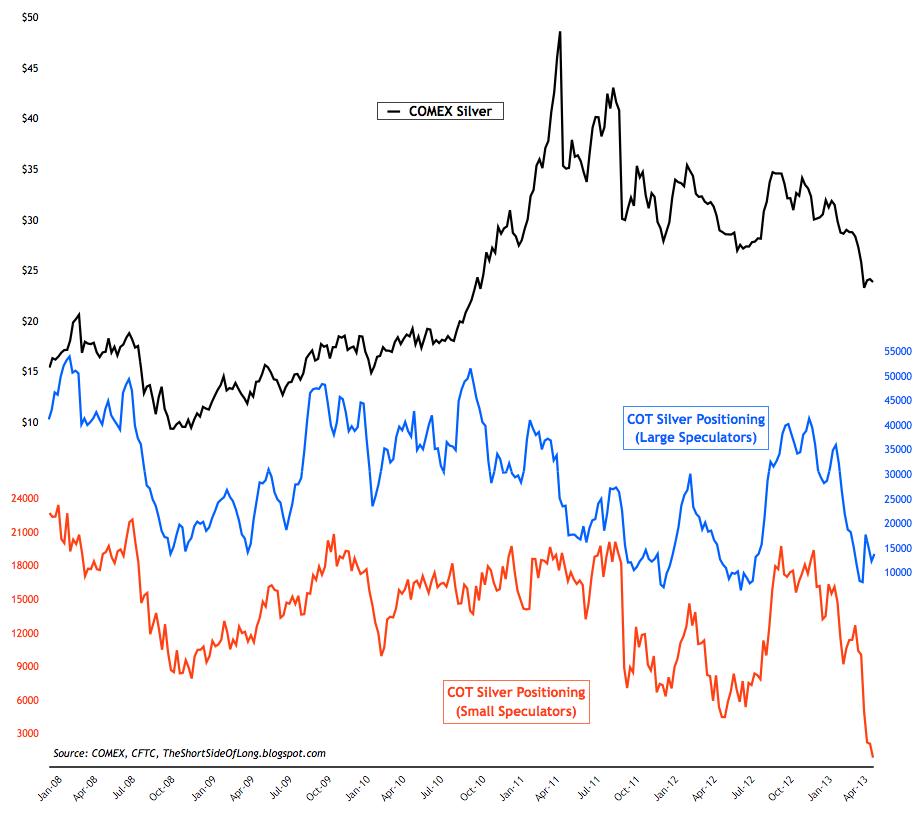
Source: Short Side of Long
Comments
No comments yet.

