Users: Nubevestor: All Pages

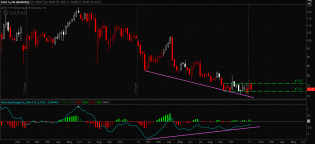
SLVVolume.png
Increased volume, successful retest of prior support and a gap above presenting a nice target and now above the 20...

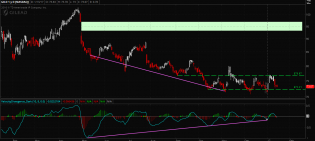
EWT.png
Taiwan looking strong here
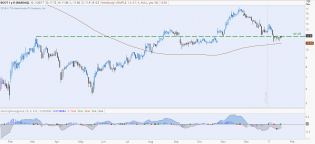
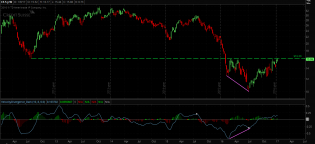
BOOT.png
Looking at Boot Barn for a possible bounce off the 200 day even though that's opposed to my fundamental view of ma...
2
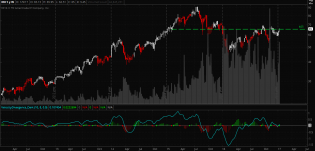
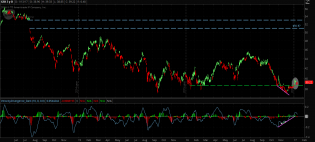
XBIWeekly.png
XBI sure is seeing a lot of volume in the last year
POT.png
Dat POT.
GILDW.png
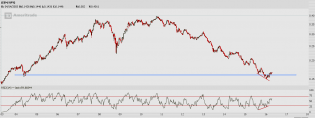
GILD Weekly with a nearly year long divergence and an attempt to build a bottom
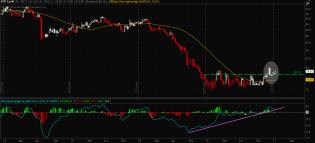
GILD2.png
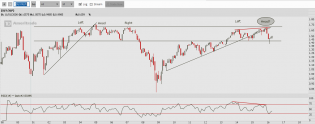
GILD Daily working on base with a lot of room to the gap above
CS.png
CS is still crazy attractive to me here.
GSK.png
GSK. Flagging above previous support off after bullish divergence with a big gap to fill way above
Screen Shot 01-08-17 at 07.53 AM 001.PNG
Credit Suisse has a nice weekly setup here for me.
EuroCad.png
Looking forward to this pulling me in by repeating history just enough to get my money, then doing the opposite. S...
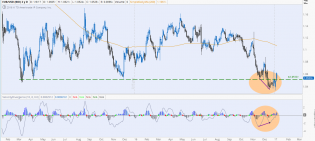
EUR_USD.png
I've dated uglier charts than this EUR/USD one. Will likely take it long with a stop (on close) below the green line
2
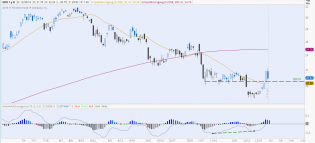
GDX.png
Good R/R here. pulling back after gapping across the 20ma. Going long here with a stop (on close) below the recent...
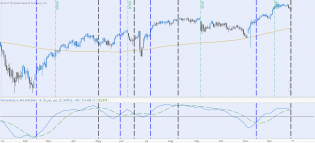
ESummation.png
Summation index making a bearish MA cross well above the 200 day. I will be avoiding new long positions until it c...
2
EWP_Weekly.png
6
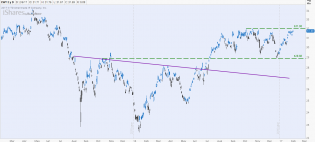
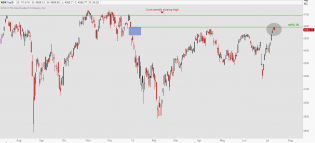
SPX.png
NDX.png
Extremely close to closing the gap followed by a bearish engulfing day. I'm sure it's nothing.
1
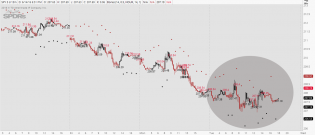
SPY.png
Dots have gone all over the place today, trend has stopped.
2
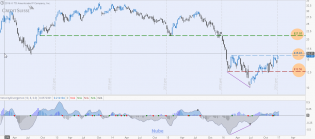
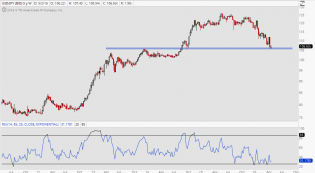
USDJPYHourly.PNG
USD/JPY Hourly
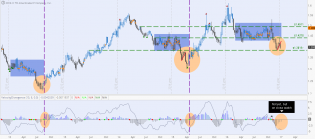
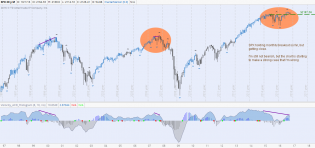
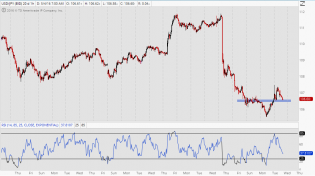
USDJPYWeekly.PNG
USD/JPY
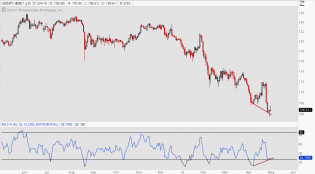
USDJPYDaily.PNG
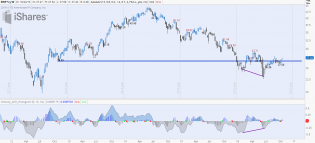
EEM-SPY.PNG
EEM regaining support relative to SPY
XLY-XLP.PNG
Dividend adjusted XLY/XLP ratio chart