Users: PatrickRafferty: djia19601980s.png
djia19601980s.png
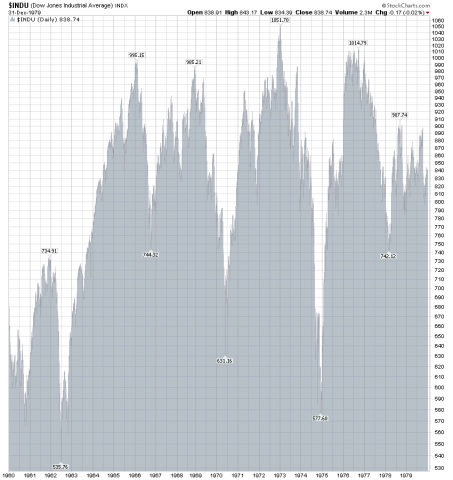
This chart is very important for anyone practicing Elliot Wave. Heres why: We are currently in a GIGANTIC wave 4. The only other wave 4 recorded in recent history occured during the 70s. This correction is one degree lower than what we are going through now. Hence, the 70s are very comparable in terms of social mood. The form prices took in the 70's demonstrates how erratic wave 4's can be. For instance, Pretcher is banking on the fact that the first sub wave of wave 4 will establish the "low" of the range, hence his predictions an imminent DOW 1000. However, placing this much emphasis on this guideline would have not worked in the 70s, and it is not working now. It is best to count the flat that began in 2000 as concluded, ending in 2009. See my other chart for the labeling.
Comments
No comments yet.


