Users: Pivotal Pivots: All Pages
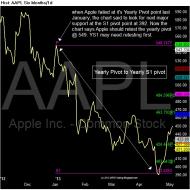
image.jpg
AAPL went from the Yearly pivot down to the Yearly S1 pivot. Now up 18% off the Loy. Looking to move back up to th...

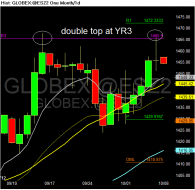
Chart of GLOBEX~@ESZ2.png
ES double top at the Yearly R3 pivot point
1
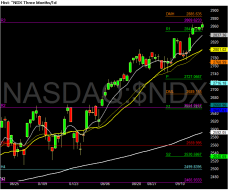
Chart of ~NDX.png
NDX testing the yearly R3 pivot point up here
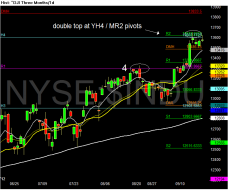
Chart of ~DJI.png
the Camarilla yearly H4 pivot point has stopped the rally so far.
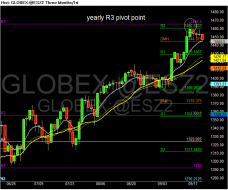
Chart of GLOBEX~@ESZ2.png
ESZ2 the yearly R3 pivot point and the monthly R2 pivot point stopped the rally so far.
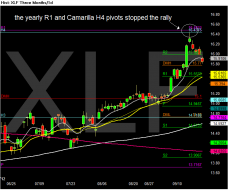
Chart of XLF.png
$XLF the yearly R1 pivot point stopped the rally and is HOY on XLF.
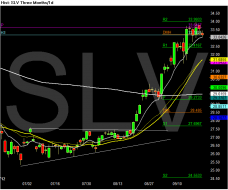
Chart of SLV.png
$SLV the monthly R2 pivot point and the yearly pivot point(P) stopped the rally, so far.
euro ihs chart.png
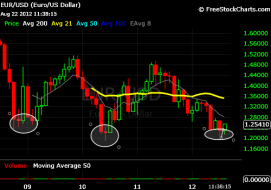
Eur/usd showing an inverse head and shoulders pattern. Big rally coming?
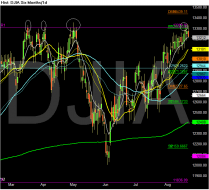
Chart of DJIA.png
the $DJIA failed again, at the Yearly R1 Pivot point(YR1). Key reversal day.
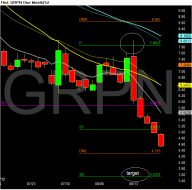
Chart of GRPN.png
$GRPN watch the monthly S2 pivot point for support. Bloomberg traders may try at the monthly Demarks low pivot(DML).
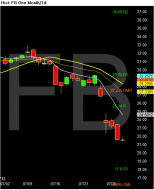
Chart of FB.png
$FB look for next support on the Aug monthly S1 pivot point @ $17.80.
1
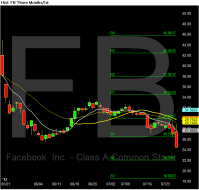
Chart of FB.png
$FB next support is at MS2 pivot point @22.09
1
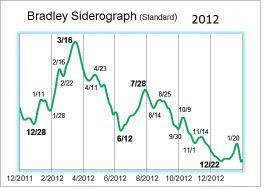
2012 bradley model.jpg
Next Bradley Model trend change date is coming up this week.
3
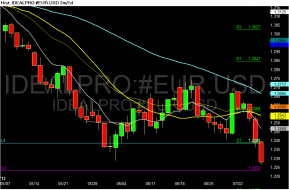
Chart of IDEALPRO~#EUR.USD.png
EUR/USD yearly S1 pivot point 1.2232
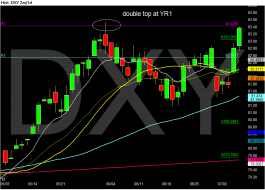
Chart of DXY.png
$DXY double top at the yearly R1 pivot point
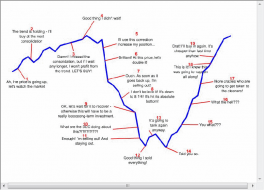
pics 078.png
A newbie trader
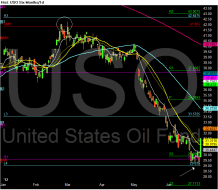
Chart of USO.png
$USO yearly S1 pivot point and the Camarilla yearly L4 pivot point caught the pullback.
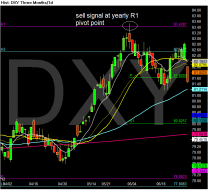
Chart of DXY.png
$DXY will the 50 day hold? Still on a YR1 sell signal.
6-28 intraday Chart of GLOBEX~@ESU2.png
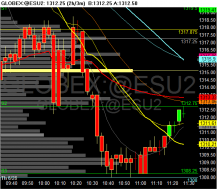
@ESU2 the daily S3 pivot point caught the fall so far today, and now is retesting the daily S2 pivot point. Pivot Power!
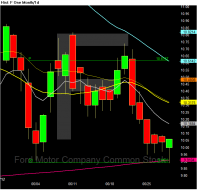
Chart of F.png
Ford(F) double bottom on the monthly S1 pivot point and the 1000 day moving average
1
Chart of XLE.gif
XLE Double bottom on the Camarilla yearly L3 pivot point and 1000 day ma.
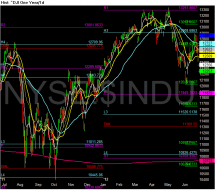
Chart of ~DJI.png
Yearly and monthly Pivot points can define support and resistance