Users: Polar: All Pages
slopechart_XOP.jpg
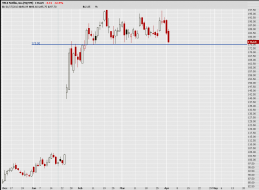
XOP possible head and shoulders formation.
1
s3.amazonaws.com/cdn2.soci..._s9xisX_l.png
ES Daily descending triangle. Need a conviction close below or above.
2
s3.amazonaws.com/cdn2.soci..._2JPzbW_l.png
2
s3.amazonaws.com/cdn2.soci..._NQ16lk_l.png
ES
1
s3.amazonaws.com/cdn2.soci..._EzYJPM_l.png
1
s3.amazonaws.com/cdn2.soci..._NPMRyD_l.png
1
s3.amazonaws.com/cdn2.soci..._fuJzrD_l.png
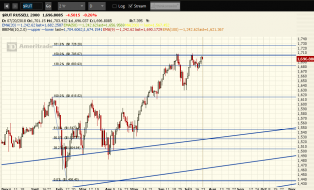
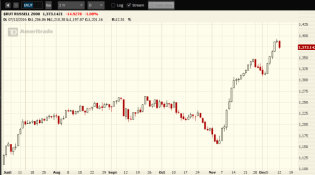
RTY still in range after near perfect tag of support
s3.amazonaws.com/cdn2.soci..._lALLr3_l.png
NQ test of support
s3.amazonaws.com/cdn2.soci..._4VUyWu_l.png
1
s3.amazonaws.com/cdn2.soci..._1CPqul_l.png
RTY support and resistance levels
s3.amazonaws.com/cdn2.soci..._7ZdN5F_l.png
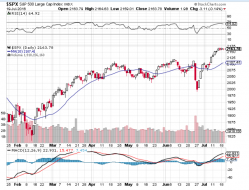
SPX monthly
1
s3.amazonaws.com/cdn2.soci..._qj6ENu_l.png
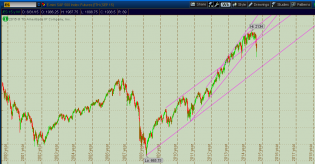
NDX monthly
s3.amazonaws.com/cdn2.soci..._XmMcus_l.png
1
s3.amazonaws.com/cdn2.soci..._6KntNn_l.png
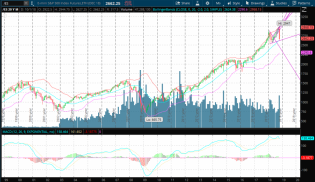
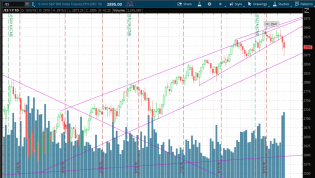
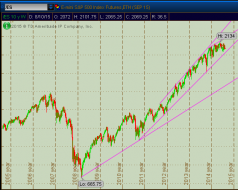
ES monthly sporting a negative MACD divergence and holding monthly middle band as support
s3.amazonaws.com/cdn2.soci..._NBzgdf_l.png
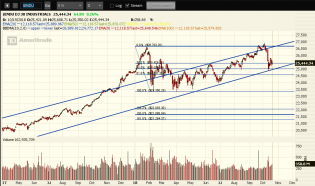
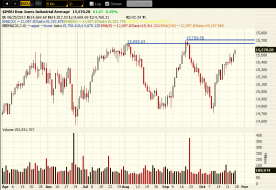
Bear Porn. Unconfirmed double top on $INDU.
s3.amazonaws.com/cdn2.soci..._iPBhVn_l.png
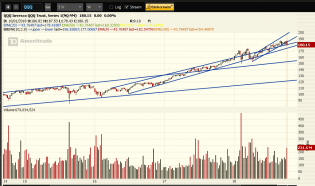
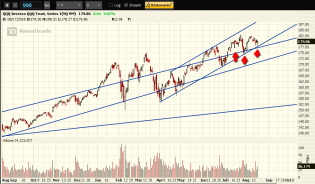
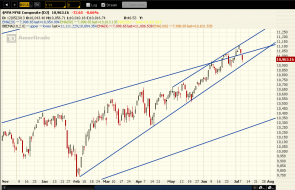
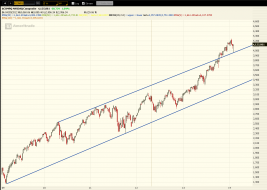
$QQQ broken channel support. Note the sequential steepening of channels.
s3.amazonaws.com/cdn2.soci..._DbAIbp_l.png
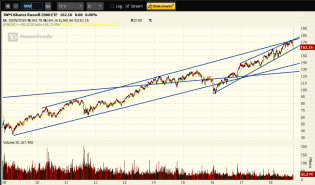
$IWM testing channel support and 200 dma.
s3.amazonaws.com/cdn2.soci..._r5iHl5_l.png
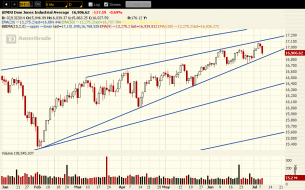
$ES Channel

s3.amazonaws.com/cdn2.soci..._etIpSr_l.png
Platinum is breaking out
1

s3.amazonaws.com/cdn2.soci..._oGN3mb_l.png
$IWM triangle
s3.amazonaws.com/cdn2.soci..._FdH6Ws_l.png
$QQQ and NQ double hammer on support. Possible IHS.

s3.amazonaws.com/cdn2.soci..._Gijjny_l.png
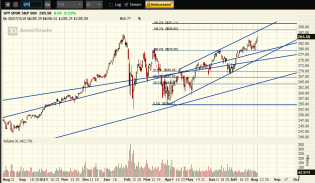
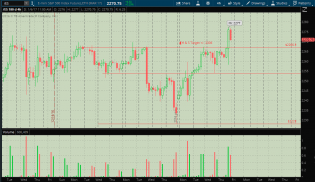
$SPX 261.8% Fibonacci extension confirms $SPY target.
s3.amazonaws.com/cdn2.soci..._QJFh7x_l.png
$SPY Double Bottom / Sloppy IHS targets $305.
s3.amazonaws.com/cdn2.soci..._rroLVb_l.png
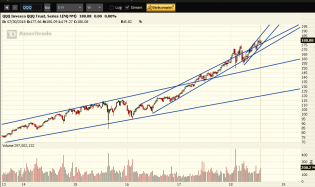
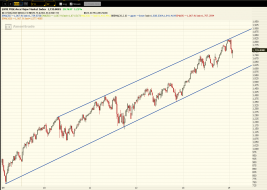
QQQ roadmap. SPY has similar sequence of steepening channels.
1
s3.amazonaws.com/cdn2.soci..._TtzQ1q_l.png
$RUT cup and handle

2018-02-13_XLU.png
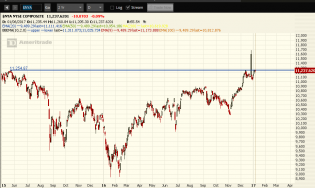
XLU bouncing off 10 year support trend line.
2018-01-19_$NYA.png
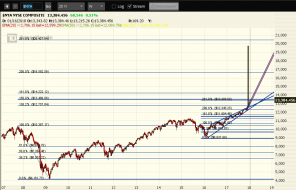
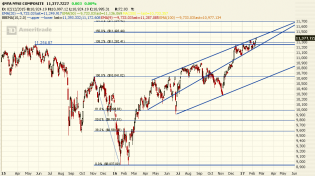
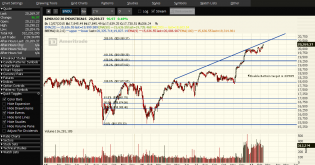
$NYA about to meet a confluence of Fibonacci extentions.
3

Spy options expiriration.jpg
David Larew $SPY trading rules. Of interest is Weird Wollie Wednesday and the Thursday or Friday low prior to opt...

2017-09-08__ESZ17.png
December ES weekly candle showing indecision

2017-09-08_NYA.png
$NYA hanging by a thread.
1

2017-08-14_spy.png
SPY wedge is still in control.

2017-08-02_SPX.png
$SPX monthly. 2485 may be a tough wall to hurdle. Give credit to Northy for pointing out this level.
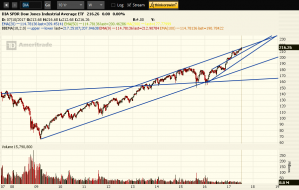
2017-07-15_DIA.png
DIA weekly testing 8 year resistance trend line

2017-06-25_NG.png
Note the Island Formation and breakaway gap.
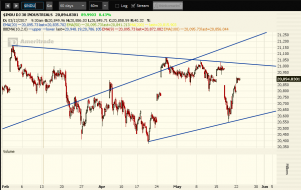
2017-05-22_INDU.png
INDU triangle. For it's limitations of having only 30 stocks, INDU respects patterns more than the other indexes.

2017-05-18_VIX.png
Seems like the safe play for now is short volatility.
1

2017-05-10_NDX.png
$NDX overbought and at resistance.
1

2017-05-02_$NDX.png

2017-05-02_COMPQ.png
Nasdaq Composite

2017-04-27_SPX.png
Long term SPX Fib targets
1

2017-04-14_SPX_LT.png
SPX with longer term moving averages. Still a long ways down to the 100 MA, the 200 MA, and the "Green Line" 250...

2017-04-14_SPX_ST.png
SPX with shorter term moving averages. Two daily closes below 50 DMA.

2017-03-30_VIX.png
Notice the pattern of gap fills.
1

2017-02-25_INDU.png
To infinity and beyond.........
Or not
2
2017-02-12_$NYA.png
2017-02-10_INDU.png
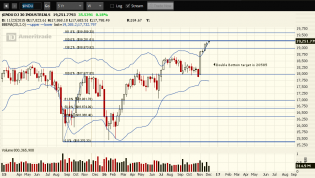
Double Bottom target of 20585 remains. Earliest target date is early early March which also fits with my $SPX tar...
2
2017-01-06_NYA.png
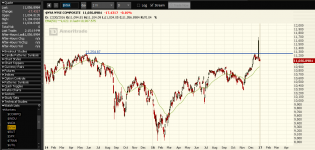
$NYA still unable to close all time high.
1
2017-01-06__ES.png
IHS on /ES 4 hour chart. Target is 2306 +/-.
1

cdn2.socialtrade.com/comsy..._vVX6M7_m.png
1

2016-12-30_GDX.png
One for Closing Basis. The upper trend line was confirmed by the failure to breakout on Friday.
2016-12-30_$NYA.png
Failed bullish breakout by $NYA.
1

2016-12-17_$SPX.png
$SPX Weekly Candle
cdn.socialtrade.com/comsys..._CnGusP_m.png
2016-12-12_RUT.png
Attractive looking candle pattern on the $RUT. Chart courtesy of David Larew.
1
2016-12-06_INDU.png
$INDU double bottom target. I realize that $INDU only tracks 30 stocks and the breakout is fundamentally suspect...

2016-07-25_NYMO.png
NYMO turns negative
1
2016-07-19_SPX.png
Note the blue line. Notice what happens when price gets too far away from the blue line. Any Questions?
3

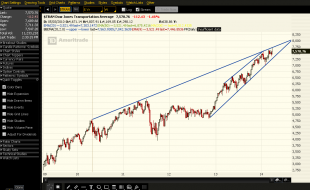
2016-07-09_TRAN.png
How art thou now Dow Theory? TRAN weekly with 50 ma.
1

2016-04-19__TF.png
Russell is facing a confluence of resistance.
2

2016-03-20_PutCallRatio.png
Put Call Ratio

2016-03-20_$NYHGH.png
Bullish extreme

MW-EF078_ChartO_20160208133004_NS.png
http://www.marketwatch.com/story/what-the-chart-of-doom-is-saying-about-a-global-recession-2016-02-08

2016-01-25_AAPL.png
Long term $AAPL chart
2

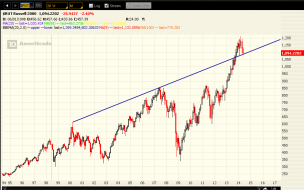
2016-01-08_TF.png
/TF Weekly
2

2015-12-19_IWM.png
1

2015-12-19_TF.png

2015-09-03_NYA.png
Broken support on the real market
2015-09-03_ES.png
Trying to climb to broken support.

2015-09-03_NQ.png
Tying to fail the bullish breakout?

2015-09-03_TF.png
Perfect bounce off long term trend line.
2015-08-11_ES.png
A little longer term perspective.

2015-06-01_$XII.png
The Institutional Index weekly. The one that matters.
4

2015-04-25_1839.png
$SPX Market map for Friday. Not much market participation in current rally. Looks like the cart is trying to pul...
2

2015-04-25_1830.png
$SPX Record new high not confirmed with lower high on stocks above 50 day moving average
1

tmg-slideshow_xl.jpg
What Every Country in the European Union Does Best

2014-07-08_XII.png
$XII Institutional index with modified Keltner Channels. Image copied from http://stockcharts.com/public/3421479/ten...
1
2014-07-08_NYA.png
$NYA short term rising channel.
2014-07-08_INDU.png
$INDU rising wedge
2014-05-15_RUT.png
Make or break time for the Russell
1
2014-04-05_TRAN.png
5 year resistance on TRAN still holding strong.
2
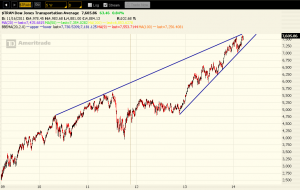
2014-03-18_TRAN.png
$TRAN is approaching 5 year resistance.
2014-02-07_$COMPQ.png
Nasdaq Composite $COMPQ 5 year channel retest
2014-02-07_$XMI.png
NYSE Arca Major Market Index 5 year channel

2013-12-28_RUT.png
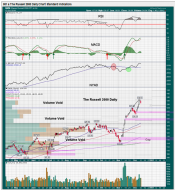
$RUT road map
1

2013-12-12_SPX-5Year.png
Old SPX resistance becomes support, for now.
2
2013-10-26_$INDU.png
$INDU is approaching resistance area.

2013-10-18_SPX.png
5 Year SPX chart. Look for possible weakness at the 1750 area.
1

2013-10-05_SPX.png
SPX 60 minute chart with bullish divergence.
1

2013-10-05_ES.png
ES 4 hour chart with bullish divergence.

2013-06-26_kbh.png
KBH head and shoulders formation and break. They report earnings on Friday.
2
2013-05-14_CI.png
One from the bearish watch list.

2013-04-23_HUM.png
Since everyone is so bullish I thought I'd throw one out from the bearish watch list. Gap fill play on a double top.

2013-04-06_TLT.png
Shooting star on TLT outside of daily bollinger band.
3
2013-04-02_NFLX.png
NFLX support

2013-04-02_AAPL.png
AAPL at double support.

2012-08-21_$INDU.png

cdn.socialtrade.com/comsys..._NwoKJS_m.png
$TRAN is testing triangle resistance.
2012-08-14_esrx.png
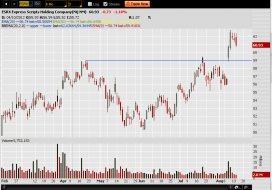
Cup and Handle breakout on ESRX.

cdn.socialtrade.com/comsys..._YtdS85_m.png
$TRAN is testing resistance at the 50DMA
1
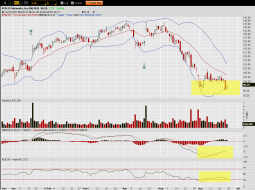
2012-06-22_FFIV.png
Bullish divergence on FFIV