User: Realestate Investor
Member Since: 10/19/14
Instruments

Realestate Investor's Profile
Personal Stacks


All Pages Stacked

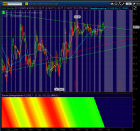
pot thermal view.png
Pretty cool bollinger band study...Thermal...$SEED broke out today. $POT tomorrow

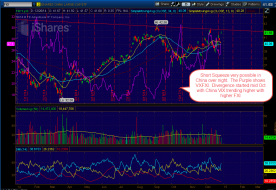
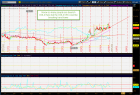
FXI with FXI VIX.png
$FXI going into tonight's manufacturing numbers China set for strong potential short squeeze..
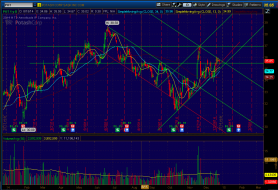
sbux.png
$SBUX looks bullish here
1
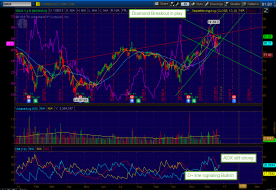
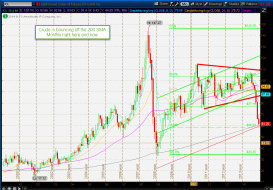
pot could be set to break out of Diamond.PNG
$POT looks like could pop out of diamond pattern...keep on radar.
energy sector VIX.PNG
XLE volatiltity chart could be signally a buy signal in energy today.
3
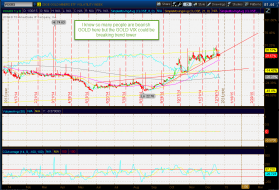
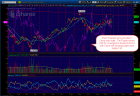
Gold with Gold VIX.png
Thinking Gold this one could find some favor soon.
1
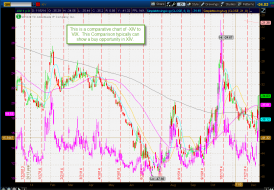
-xiv vix comparison.png
I like using this chart to help identify better entry and exit points in XIV. This chart overlays the -XIV with $...
crude.png
Crude looking very very interesting for a bounce here. $OIL
3
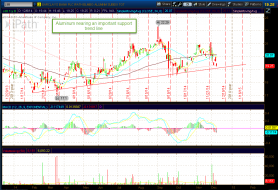
jju.png
$JJU I am using this index for entry point in $AA or $CENX long this week.
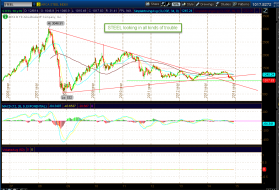
steel.png
$STEEL sector almost back to 6-24-13 lows.
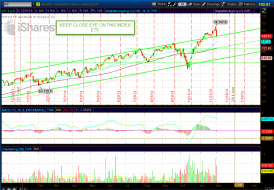
2014-12-08_16-31-24.png
XLE in a whole lot of trouble here
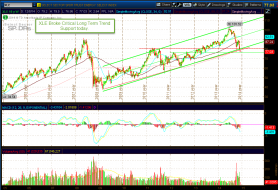
IYT.png
The key market sell signal?
1
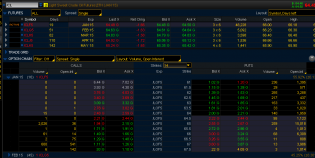
crude option futures already active.png
$65 Calls on Crude already active tonight
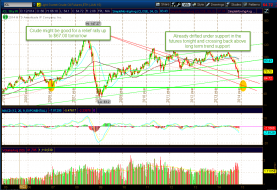
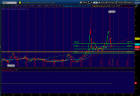
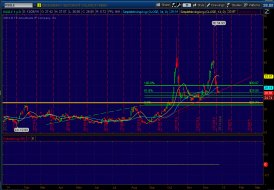
crude futures.png
I went long the futures tonight at $64.25. There should be short term support here.
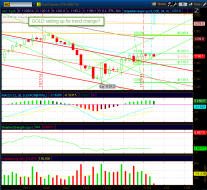
gold.png
Has Gold topped here?
1