User: Sam Jacob
Member Since: 6/3/12
Instruments

Sam Jacob's Profile
All Pages Stacked
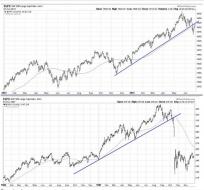
spx_compare.JPG
SPX current chart(top) and the 1987 chart(below) looks kind of similar. Don't think 1987 is going to repeat, but...

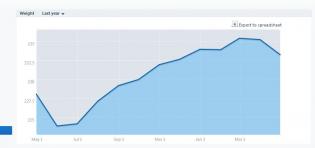
loseitwght.JPG
This chart is from Loseit, where i track my weight every day. Just realized that it was tracking up since the june...
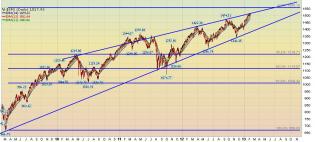
spx_2013.JPG
Market still in a Uptrend , My target is 1560, sometime in 2013
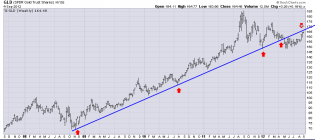
Screen Shot 2012-09-04 at 9.47.04 PM.png
Gold touching trendline from below.....
1
Screen Shot 2012-09-03 at 7.12.50 AM.png
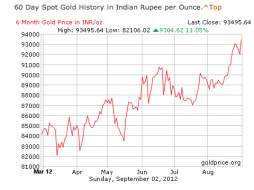
India is the biggest consumer of Gold. With Friday's big rally, Gold, priced in Indian Rupee, has reached the hig...
Screen Shot 2012-08-29 at 10.47.41 AM.png
Turned back at resistance
1
Screen Shot 2012-07-08 at 7.37.28 PM.png
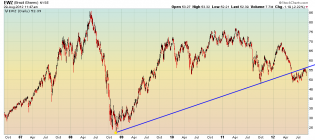
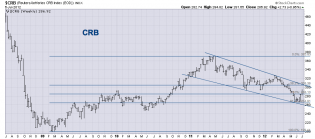
CRB retraced back 61.8% of of the uptrend from 2009 and put in a flag pattern. Bullish for the next year i think.
Screen Shot 2012-07-08 at 8.37.21 AM.png
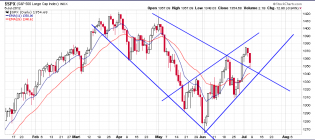
Two conflicting wedges, one bullish and the other bearish, which one will win, we will see in the next couple of d...
2
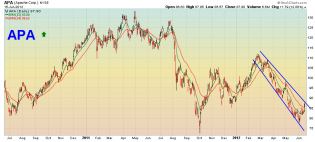
Screen Shot 2012-06-16 at 3.20.17 PM.png
APA- bullish wedge and chart looks bullish
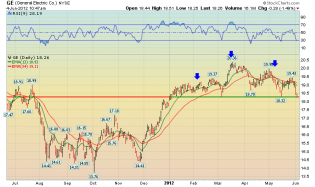
Screen Shot 2012-06-04 at 9.47.43 AM.png
GE H&S