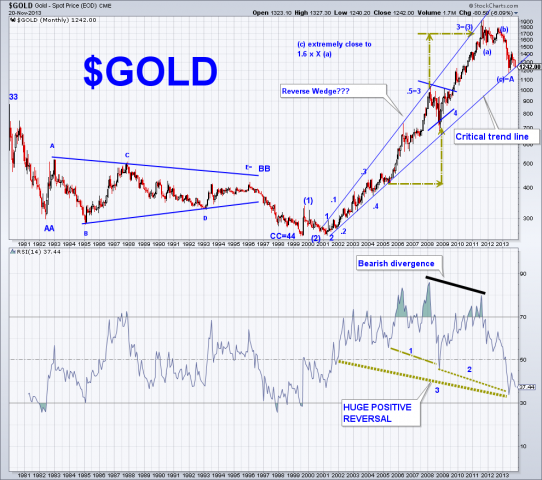
Gold is at a critical long term uptrend line. Based on the new positive reversal (2) in the RSI and the form of the decline so far from the peak I think there is a good chance the down move so far (labeled A) is the first wave down of 5 waves to form a triangle before a final burst up in year or two. If correct the low at 1179 should not be taken out and a reversal is soon at hand. This fits I think well with my interpretation of the US dollar which I see falling over the next year or two. I will be watching this closely. If I am correct it will provide some great trading opportunities. “Reverse Wedge”? I made that up. If it ever turns out to be a real pattern remember you saw it here. Have a great rest of the week and weekend. Tom B 11/20/13
 Tomb
Tomb

