Browse Symbol Stacks: $GOLD
kdc.jpg
Message from KimDotCom. With a name beginning with Kim shouldn't he be CEO of North Korea or somewhere like that?

2 feb21.PNG

1
goldsilver.jpg
You could be up 24% today if you buy discounted Talisker's single malt from Tesco.
1 Aug15.PNG
3
gold.jpg
2 aug20.png
1
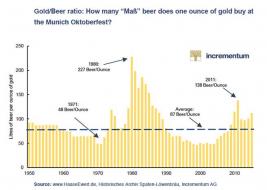
goldbeerratio.jpg
I would like to introduce you to the gold/beer ratio. How many beers can you get per ounce of gold? I think you'll...
4
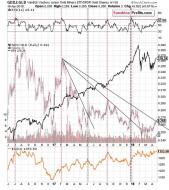
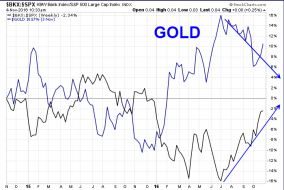
GDXJGLD.jpg
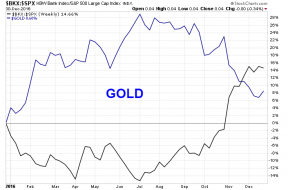
GDXJ:GLD and SPY
gold.jpg
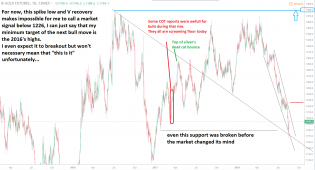
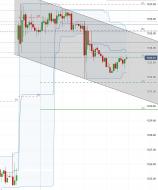
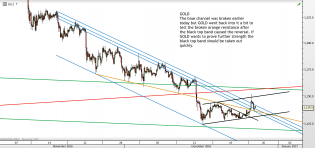
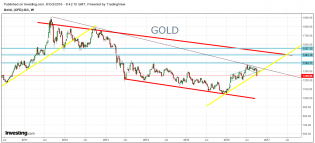
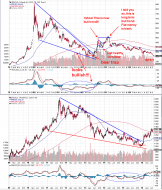
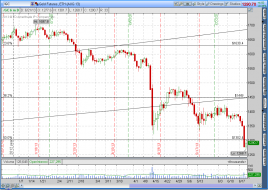
Bull flag channel formed on spot gold after North Korea's nuclear test. Suspect that S3 pivot will be tested down...
3

usdgold.jpg
What happened today slightly goes against the flow of the $USD:$gold chart. Interesting chart.
20170514_DebtLimit.png
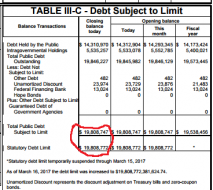
Debt limit hit the ceiling. That means reduced Treasury supply until the debt ceiling is raised. That is bullish f...

1
20170305_GOLD2SPX.png
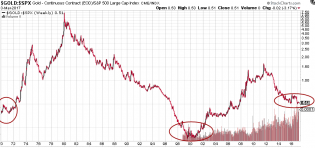
GOLD to SPX. there is some similarity
20170221_ChinaM1YoY.png
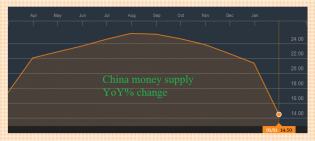
M1* YoY% change has extended decline in January. China economy is going to burst.
*M1 is most approapriate to m...
20170121_GOLD_2_M1.png
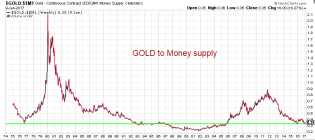
Gold is cheap, but not as cheap as of 2001
1
20170101_GOLD.png
Fundamentals still looks bearish for gold. This rally must be sold.
7
gold.jpg
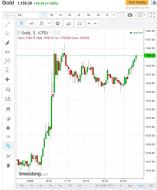
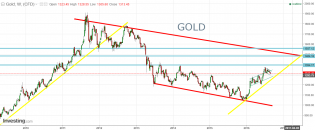
Update on the daily spot gold chart. Perfect flag. Mostly green climb.
4
gold.jpg
3
goldH2log.png
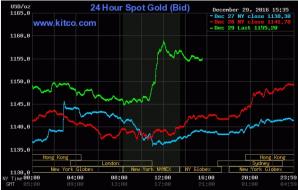
Spot gold has been a real tease over the last 36 hours.

3
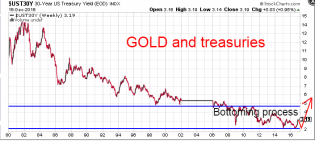
20161217_UST30Y.png
As Austrian school of economis says the main reason for boom/burst circle is credit expansion/contraction. Recent...
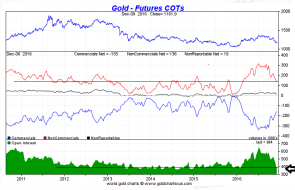
20161210_GOLD_COT.png
GOLD COT. looks like most speculators have gone.
20161104_GOLD.png
looks bearish for gold
1
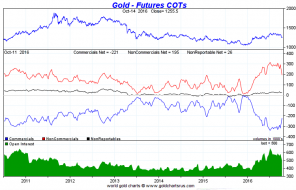
20161016_GOLD_COT.png
COT has drop to May level.
20161008_GOLD.png
I guess correction is not over
1
200160901_gold.png
still looks bullish
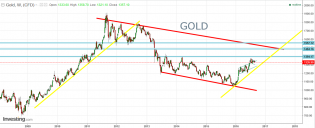
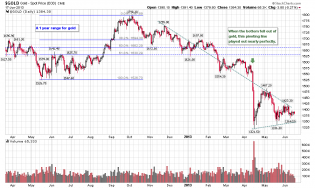
20160825_gold.png
Looks bullish. Gold is going to test red line resistance in coming months.
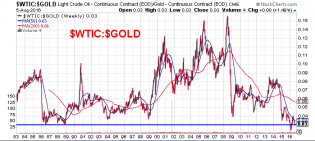
20160806_WTIC_GOLD.png
sell some gold buy some oil
2
20160730_2golds.png
I don't say gold is not in bull market. Just keep in mind there is bear case. The difference between now and 1982...
15
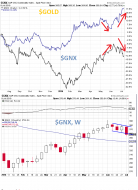
20160709_GOLD_GNX.png
I don't say gold can't go higher. But there is something to worry about.
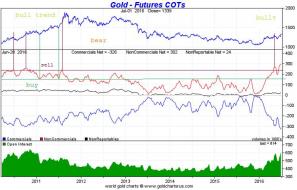
GOLD_COT.jpg
This is free chart from www.sharelynx.com
It represent COT data for GOLD.
IF gold is in bull trend then horizont...
2
GOLD20160702.jpg
Looks like Gold have done false start this year. Too many opened long positions by short term speculators acording...
8
GDX - Weekly 11.4.2015.png
GDX weekly. This is an opinion and not investment advice.

4
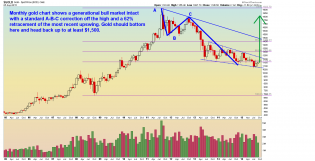
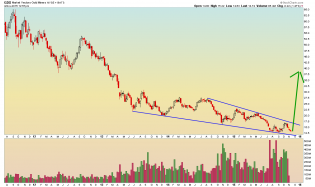
Monthly Gold.png
Monthly gold. (Obviously I misplaced the A-B-C, but I think people will get it). This is an opinion and not investmen...
1
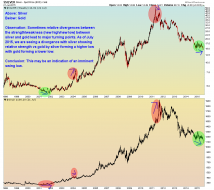
Silver and Gold Weekly - 7.22.15.png
Weekly silver (above) and gold (below). This is an opinion and not investment advice.
1
Gold

gold.png

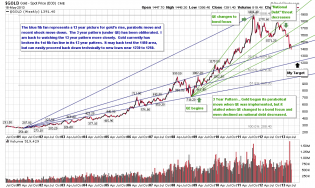
Daily Gold V.png
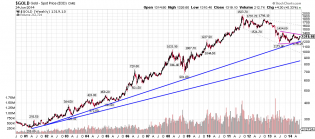
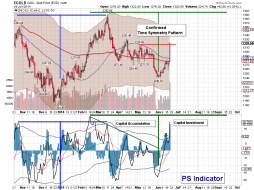
$GOLD confirmed a new Capital Investment period that runs through September. We're positioning long.

$GOLD daily 12.22.13sc.png
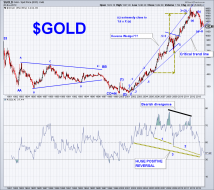
I know Tim is very bearish on gold. I know the intermediate and short term trends are down. I also know Tim is a l...

1
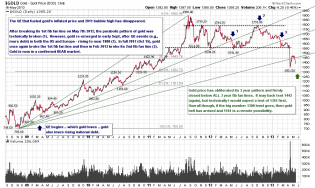
GOLD monthly 11.20.13sc.png
Gold time for boom or bust??? Please see comments below. This is a monthly log chart.
3
gold.png
gold perfectly back tested its broken fib line this morning .. 1302 looking like a key level and current resistance ..

sc.png
addendum to comment above .. here is a daily gold I am watching .. note the wedge pattern setting up a possible 2n...
sc.png
Gold Short Term .. I am looking for a test of 1351 area .. many tried to catch a "falling knife" with gold Thursda...
2
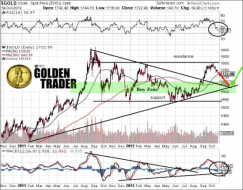
sc.png
Gold update .. the convergence of the 3 yr and 13 yr fib fan lines was broken today by closing price .. gold buyer...
2
sc.png
Gold - why I am shorter than the curb in front of our house ..
3
sc.png
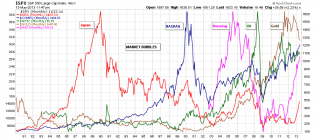
Bubbles
6
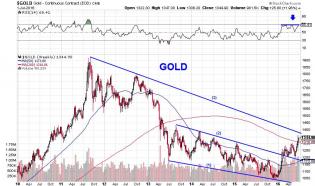
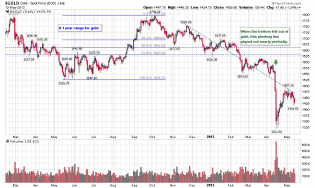
$GOLD (Gold - Spot Price (EOD)) CME

$GOLD
Daily gold chart for 2012

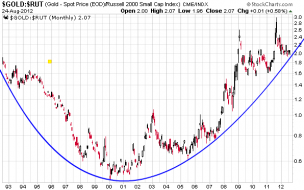
GOLD-RUT-20120824.png
Pair trade: buy gold, sell equities. (SPX and INDU look about the same, with less volatility). Monthly chart of...

Screen Shot 2012-08-03 at 3.22.28 PM.png
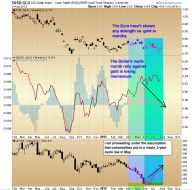
A look at the recent relationship between gold, the Euro, and the Dollar. I think we're seeing strength move to gold.
