View: TLT weekly sc.png
TLT weekly sc.png
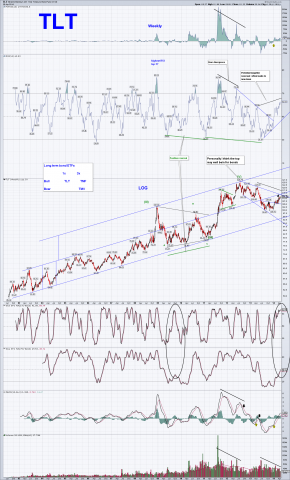
TLT Weekly long term: This is my read on long term US bonds. It agrees with the excellent chart posted by Mike 1981. TLT is currently in an uptrend but it looks like it is getting vulnerable to resumption of a downtrend. There is a lot of overhead resistance just ahead. The short term stochastic is overbought while the longer term stochastic is <50. Volume is dropping again. This makes a good set up for a fall. Also the RSI is rising but faster than the price (indicating price is weak relative to the indicator) leading to a potential negative reversal. Personally I have closed out my long position. I suspect if stocks continue to fall this week there likely will be additional gain in the TLT. So I am waiting for a reversal candle pattern or uptrend line break before going short. Take care. Have a good trading week ahead. Tom


i totally agree ive got my finger on the tbt trigger 4/26/14