View: $RUT Weekly log 7.20.14.png
$RUT Weekly log 7.20.14.png
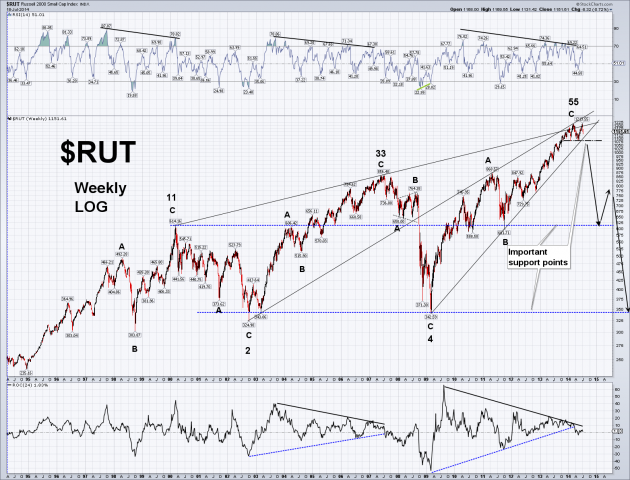
Russell 2000. Weekly log chart. Please also see IWM weekly linear chart posted today. This is a follow up of a previous post (6.2214) on the idea that long term the RUT has the form of 5 overlapping waves each of which has an A-B-C form. This is a pattern that supposedly when finished is very bearish. I think personally there is a good change it has now peaked. Typically the 5th wave overshoots the top line which has happened. There are divergences in many indicators as we can see on both charts. Of course divergences DO NOT always lead to a fall but many falls are preceded by divergences. Also the linear IWM chart shows a good (to me) completed channel and the A-B-C form seems convincing to me. The proof is in the price. But should the current the shorter term uptrend line and support be broken it may well lead to a large drop. We’ll see. Have a great week. Tom B
Comments
No comments yet.


