Browse Symbol Stacks: $RUT
slopechart_$RUT.jpg
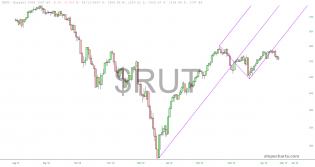
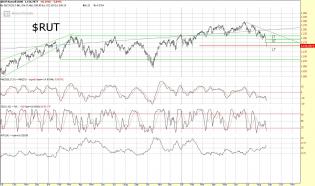
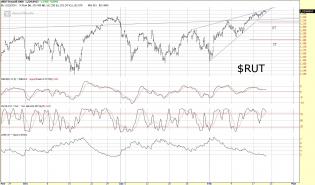
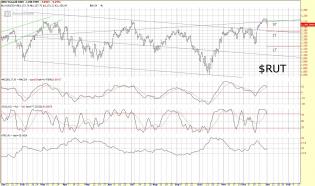
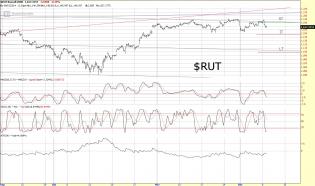
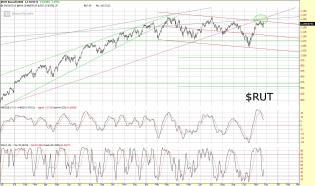
$RUT
Purple crayons applied.
That's a pretty snazy one that it just broke above.
Problem might be that th...

1
slopechart_$RUT.jpg
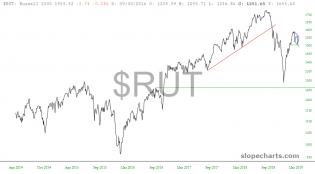
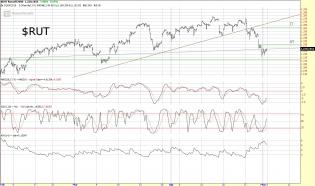
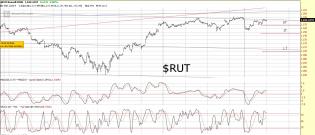
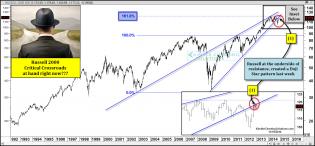
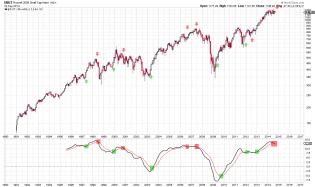
Russell 2000
Outta morbid curiosity I went and took a look at this thing. New all time high.
Right into a bi...
1
slopechart_$RUT.jpg

slopechart_$RUT.jpg
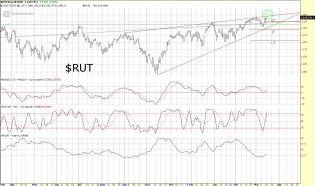
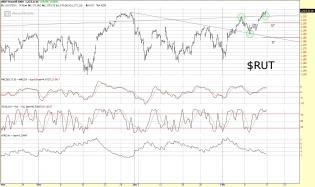
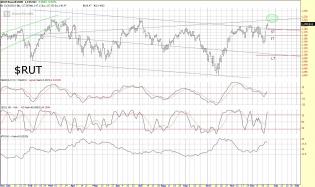
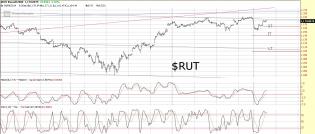
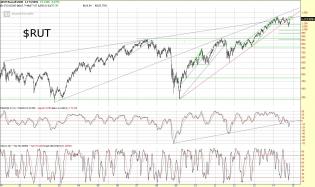
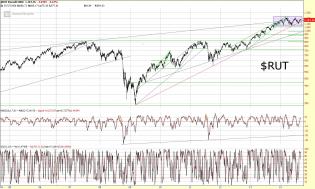
Diamond on the Rüssell
but, mind the positioning!

slopechart_$RUT.jpg
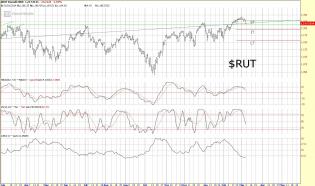
so far, so good
slopechart_$RUT.jpg
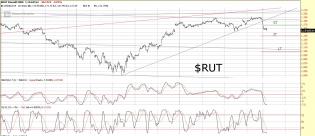
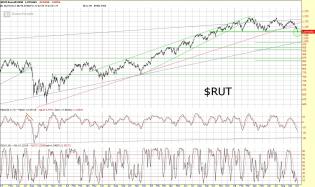
Will we get an analog? 200 points of room
1
slopechart_$RUT.jpg
Follow up chart regarding discussion in last thread.
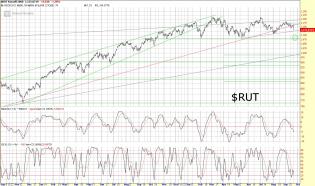
20/50/200/356 SMA shown. (bear porno foursome)
Happy Friday!
slopechart_$RUT.jpg
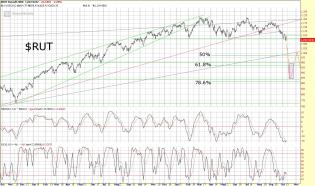
Might be a good spot for an actual bounce. Right on the 50% fib. and at the bottom of the channel. Right or wrong...

slopechart_$RUT.jpg
Fun with fibs! I think the RUT is heading for the 50% line where a bounce could take it back to the 61.8 fairly quickly.
slopechart_$RUT.jpg
RUT
In the past I have not spent a lot of time staring at the RUT. Maybe because in a ridiculous bull market th...
slopechart_$RUT.jpg
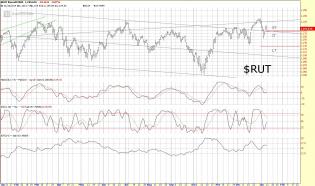
I made a new box for the Russell. In case it decides to run sideways for another year.
slopechart_$RUT.jpg
Russell 2000 with Fib levels from the March 2020 bottom plus Hunter insanity square
1 Feb9.PNG

5
slopechart_$RUT.jpg
Wow!

1
slopechart_$RUT.jpg
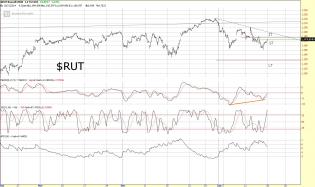
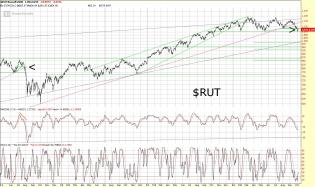
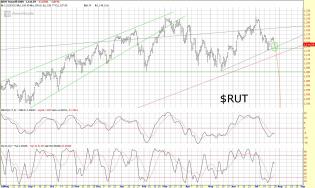
I found a possible resistance level for the bears on this rising megaphone pattern.
slopechart_$RUT.jpg
3
slopechart_$RUT.jpg
Shorts in a RUT
1
2020-11-10_11-36-46.jpg (1280×496)
This is the biggest 2 day outperformance of the Russell 2000 over the Nasdaq 100 since March 2001...

slopechart_$RUT.jpg
Don't tell me the fucking trendline held - noooo!
1
slopechart_$RUT.jpg
The Russell 2000 uptrend is tested
3
slopechart_$RUT.jpg
As good a place as any to stop, I guess.
slopechart_$RUT.jpg
It hasn't meant very much during this uptrend, but $RUT turned around at a near perfect hit of the 38.2% fib level...
slopechart_$RUT.jpg
could finally get interesting

3
slopechart_$RUT.jpg
Earlier comment in regard made me go take a peek.
slopechart_$RUT.jpg
slopechart_$RUT.jpg
Russell 2000 at 50% fib. Maybe it holds?
1
slopechart_$RUT.jpg
Russell 2000 is at the 61.8% fib, which might also serve as a major bottom. I borrowed the purple dotted line fro...
ibd-small-cap-breakout-attempt-in-play-nov-25.jpg (1852×899)
iwm
2
slopechart_$RUT.jpg
$RUT kissing the 200 MA
slopechart_$RUT.jpg

2
slopechart_$RUT.jpg
A little different from Tim's chart this morning
slopechart_$RUT.jpg
If that's a bull flag, the measured move would be around 1900.
rut-3.png (1240×982)
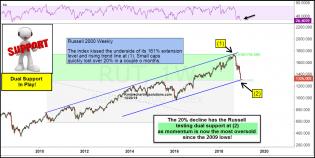
russell-testing-dual-support-with-momentum-at-2009-lows-dec-21.j...
1
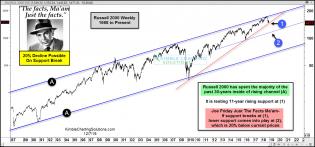
joe-friday-russell-could-fall-20-percent-if-support-gives-way-dec-7...
1
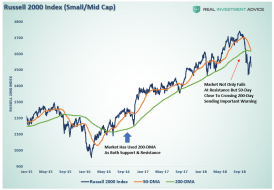
Russell-2000-Index-111218.png (885×613)
1

slopechart_$RUT.jpg

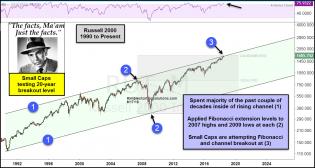
joe-friday-small-caps-attempting-20-year-breakout-aug-17.jpg (12...
1
s3.amazonaws.com/cdn2.soci..._TtzQ1q_l.png
$RUT cup and handle
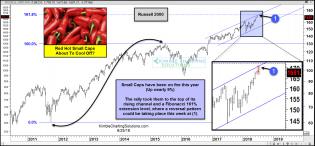
small-caps-russell-red-hot-create-bearish-reversal-pattern-june-...
3
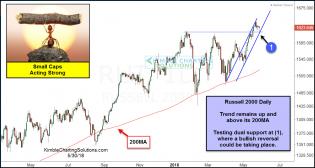
russell-acting-strong-testing-dual-support-may-30.jpg (1228×658)
Small Caps acting strong & testing dual support
2018-05-30_7-15-56.jpg (890×469)
1
2018-05-16_9-38-28.jpg (890×466)
Russell 2000 Surges To Record High As US Economic Data Dumps
1
Bildschirmfoto 2017-12-09 um 10.35.12.png

1
20171002_eod5.jpg (955×477)
Russell 2000 small caps most overbought in 20 years...
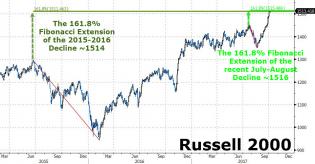
20171005_RUT.jpg (959×502)
For example, in this case, we see the Russell 2000 now reaching the vicinity of the 161.8% Fibonacci Extensions of...
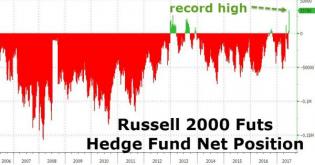
Hedge Funds Have Never Been This Bullish About Small-Cap Stocks...
Over 57,000 Russell 2000 e-mini contract longs were added in the last two weeks - the most since July 2008 - leavi...
1
20170618_RUT2.jpg (962×500)
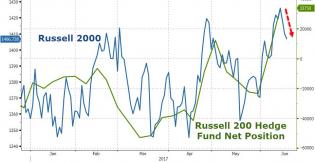
The last two weeks have seen the biggest increase in hedge fund bullish Russell 2000 positions since July 2008 pus...
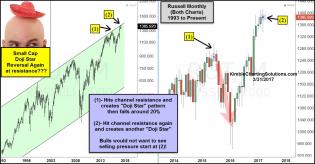
russell-create-another-doji-start-monthly-reversal-pattern-at-15-ye...
The two charts below of the Russell 2000 index might be very important to keep an eye on. Both are monthly charts...
2
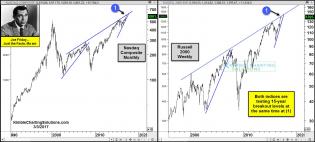
joe-friday-nasdaq-and-russell-testing-15-year-breakout-levels-march...
Nasdaq & Russell attempting 15-year breakouts
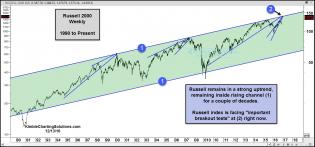
russell-at-top-of-25-year-rising-channel-dec-13.jpg (1572×734)
Russelll channel
2
cdn.socialtrade.com/comsys..._CnGusP_m.png
2016-12-12_RUT.png
Attractive looking candle pattern on the $RUT. Chart courtesy of David Larew.
1
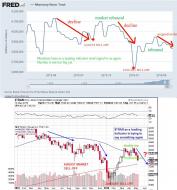
MonetaryBase_TRAN.jpg
Carnage is coming back this summer.

1
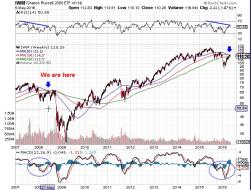
iwm_weekly_2008_analog.jpg
I am short on iwm
3
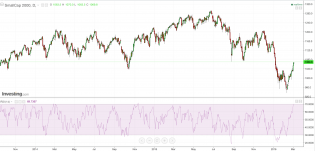
Russell 2000 - Weekly - 3.3.2016.png
Russell 2000 weekly chart. This is not investment advice.

4
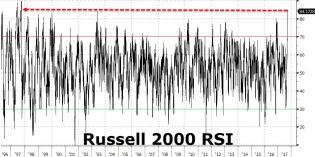
tf3.png (2836×1368)
Check out the mega-high RSI
3
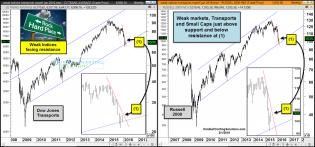
transportsrussell-rock-and-hard-place-feb-1.jpg (1570×733)
Transports, Russell, and their trendlines
1
Russell 2000 - Weekly 1.22.2016.png
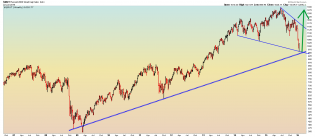
Russell 2000 weekly shows bullish falling wedge back to bull market trendline support. This is not investment advice.
5
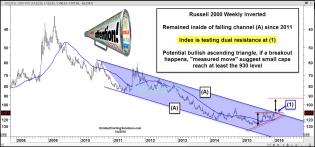
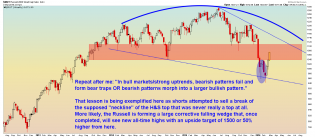
russsell2000invertedpotentialbreakoutjan4.jpg (1572×734)
Small caps: doomed as doomed can be.

small-and-mic-cap-hanging-onto-support-dec-22.jpg (1565×682)
Channels for the MidCap and Russell
1
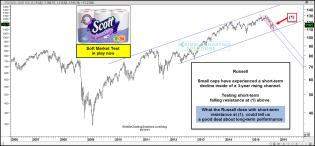
russell2000shorttermsoftnesstestoct121.jpg (1571×732)
Important test of the downtrend for small caps, particularly since the prospect of a break channel break is looming
content.screencast.com/use...929Analog.gif
1929 Analog Update

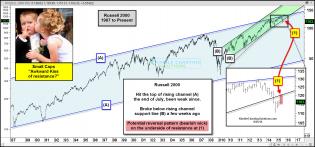
russell2000awkardkissofresistancesept21.jpg (1569×735)
Small Caps- Reversal pattern makes this key price level critical
1
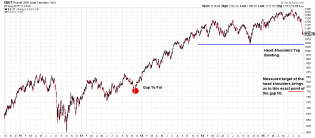
rut.png
$RUT: Food for thought. Gap to fill with a perfect measured target if the pattern which is building. Right shoulde...

2
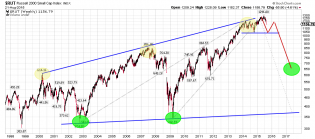
Rut.png
$Rut: Russell. I have been watching this play out all year. I think it is very reasonable that price action forms...
1
content.screencast.com/use.../RUT82215.jpg
$RUT Daily Chart
Wild week, eh? Congrats to the bears who profited. I'll get the next one, promise. ;) Until...
content.screencast.com/use...4/RUT5115.jpg
$RUT Hourly Chart
Some damage was done to the Russell this week, as it showed the most weakness of the major in...
content.screencast.com/use.../RUT31615.jpg
Updated $RUT Daily Chart
After successfully backtesting the breakout of the 1212 level, the Russell has continu...
content.screencast.com/use...a/RUT3615.jpg
$RUT Daily Chart
Here's your TnR weekend update. The Russell finally got a short term sell reversal this week,...
1
content.screencast.com/use.../RUT21915.jpg
$RUT Hourly Chart
From a charting perspective, easy to see why this has been a boring week, as we're at the top...
3
content.screencast.com/use.../RUT21315.jpg
$RUT Hourly Chart
The Russell continues to perform beautifully, from the bullish perspective. The rise that be...
3

content.screencast.com/use.../RUT12815.jpg
$RUT Hourly Chart
Starting to get a bit more interesting in bearland, eh? Today's action moved the Russell to...
3
content.screencast.com/use.../RUT11615.jpg
$RUT Hourly Chart
The Russell broke through to a short term buy reversal this afternoon. It remains on a long...
2
content.screencast.com/use...6/RUT1915.jpg
$RUT Daily Chart
Updated ST and IT reversal levels. ST Buy, IT Buy, LT Buy.
ST and IT have clustered together...
1
content.screencast.com/use...f/RUT1215.jpg
$RUT Daily Chart
Updated ST, IT, LT Reversal levels. Currently on a short term sell, intermediate term buy, lo...
2
content.screencast.com/use...RUT121914.jpg
$RUT Daily Chart
Just one chart this week to look at. I'll be gone most of next week. Updated intermediate an...
content.screencast.com/use...RUT121214.jpg
$RUT Hourly Chart
Updated short term & intermediate term reversal levels. Of the major indices, the RUT continues...
content.screencast.com/use.../RUT12914.jpg
$RUT Hourly Chart
Amazingly enough, the Russell reversed hard back higher today, and reversed back to a buy on...
content.screencast.com/use.../RUT12814.jpg
$RUT Hourly Chart
Today's selloff moved the Russell to a short term sell. Chart continues to look rather chopp...
2
content.screencast.com/use.../RUT12514.jpg
$RUT Hourly Chart
Updated ST and IT reversal levels. The Russell remains on a buy on all timeframes.
2
content.screencast.com/use.../RUT12314.jpg
Updated $RUT chart with reversal levels.
Still on a buy across the board.
content.screencast.com/use.../RUT12114.jpg
Updated RUT Chart
Here's what the updated $RUT chart looks like with the current Average True Range reversal si...
1
content.screencast.com/use...RUT112114.jpg
Here's what my RUT daily chart looks like. I would say I'm neutral on it at the moment. In spite of the strength...
content.screencast.com/use...RUT111914.jpg
Well, the bears finally got the stones up to take back control of the Russell, with today's move back under 1159....
1
blog.kimblechartingsolutio...adsnov101.jpg
Simple. Purty.
2
content.screencast.com/use...RUT103114.jpg
No more pretty bearish forecasts, just an honest look at a long term RUT chart. If you step back and look at a 15...
1
content.screencast.com/use.../RUT10914.jpg
Ready to transpire, in all of its glory, before your eyes. If desperation is a stinky cologne, overdue justice is...
content.screencast.com/use.../RUT10614.jpg
Can't help but notice the similarities. Notice at the beginning of August 2011, $RUT after approaching key suppor...
content.screencast.com/use.../RUT10214.jpg
$RUT Daily Chart
I told you guys this morning that today was the day. In fact, today, 10/2/14, will go down as...
3
content.screencast.com/use.../RUT92214.jpg
This chart has a date with its 1080 destiny...preferably this week.
rutro.png
Russel 2000 in trouble? According to this simple long term indicator it has been accurate for the past 20 years.
3
content.screencast.com/use...1/RUT9414.jpg
The most crucial bearish formation since 2008, with a break under RUT 1080.
4
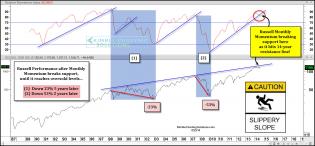
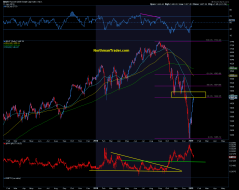
russellmomentumbreaksupportdeclinesaug25.jpg (1571×732)
Russell Momentum breaking down
1
content.screencast.com/use.../RUT72514.jpg
$RUT Daily Chart
I believe we are approaching a bearish point of recognition on the RUT. When we are able to b...
2
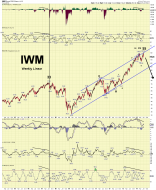
IWM weekly linear 7.20.14.png
Russell 2000. Weekly linear chart. Please also see RUT weekly log chart posted today. This is a follow up of a...

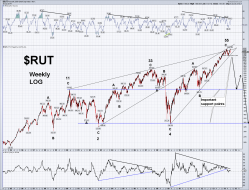
$RUT Weekly log 7.20.14.png
Russell 2000. Weekly log chart. Please also see IWM weekly linear chart posted today. This is a follow up of a...
content.screencast.com/use.../RUT71814.jpg
$RUT Daily Chart
The view from Revolution headquarters....
2
content.screencast.com/use.../RUT71514.jpg
$RUT Hourly Chart
Just so you don't think I've lost my bearish mind, here's what I'm thinking short term on RUT...
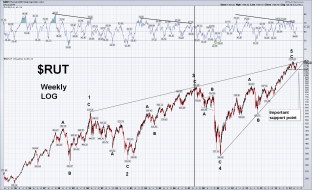
$RUT Weekly LOG 6.22.14.png
$RUT weekly log: This is a follow up a post I made on 10/18/13. At that time I said: "One pattern formation that...