Until you get some parallel space between those MAs both running at a 30 to 50 degree angle again - you might have to sit on your hands for a while. I could see using that with a protractor and caliper Certain angles w specific 10000th of an inch inflections type of thing. That would be different- I kid a little slightly butwould not want to tolerate any draw down 2/21/16
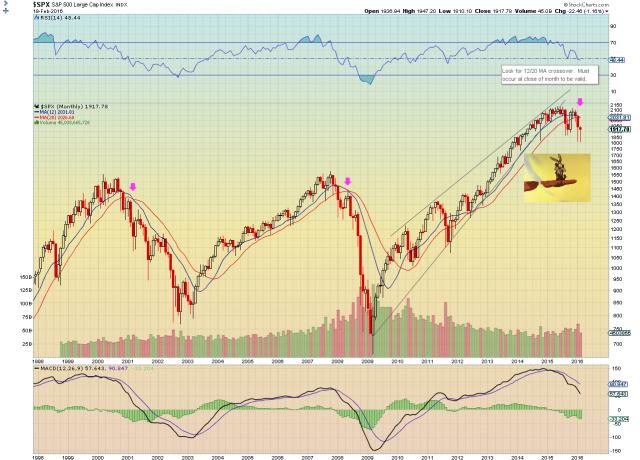
The signal is when they cross; they don't have to run. Only valid though at the close of the month, as noted. It's a useful chart for non-technical trading friends, family who aren't or shouldn't be trying to pick tops and bottoms. 2/21/16
This is a fine chart, but signals like this where there are two observations in a sample are meaningless. MA crossovers in a strong uptrend only tell you what we already know: that the market is in consolidation. Look at the chart and notice we are at all-time highs. That means there is no supply above us; there are no prior trades; there is no ceiling. That implies, along with the momentum into the all-time high, that this is a very strong uptrend and in strong uptrends, MA crossovers imply consolidation and not a top. A major top after a strong uptrend will only occur after several MA crossovers and several consolidations. This is the first consolidation/MA crossover since the breakout move started, which means very low odds of this being a major top. 2/22/16
Thanks for the feedback. I'd challenge the assertion that there is 'momentum into the all-time high'. The MACD suggests otherwise. There was a brief MA crossover in mid-2012. At that time the MACD was pointing up and I'd agree with you assessment in that situation; a false signal, but one easily diagnosed thanks to the MACD. The recent MACD is looking very different, and very similar to what it looked like in '01 and '08 at the top. You don't get divergence on monthly charts. That said, the MAs haven't crossed yet. We'd need a solid down week this week for the signal to validate a long-term trend change. I believe we'll push up to the 2060 area before turning back. But if/when the MAs do cross, they're a strong validation that the long-term trend has turned negative, as they were in '01 and '08. The nice thing with this chart is that there aren't a lot of false signals/whipsaws.
For most people on Slope, this is a curiosity more than a trading tool - people are day and swing trading on intraday and daily charts. This is a tool that's helpful to anyone with IRAs or 401k funds who can't move things around constantly, and who want to do something more vigilant than buy and hold, or wait and hope. As always, YMMV.... 2/22/16
Thanks for the response. The MACD can be a wonderful tool, however, in strong trends, MACD crossovers, just like MA crossovers, simply don't work. It doesn't work because momentum is too strong and the market doesn't care that the MACD is in a negative crossover position. We have to remember what the MACD is telling us: is is telling us that the range between two moving averages is thinning and often times, that leads to a top, but just as often if not more often, in strong up trends, a MACD crossover leads to sideways consolidation while the MACD recycles back to zero. That appears to be what is happening now and what will happen is those who use MACD and are short are going to watch the market move sideways as the MACD heads back to zero and they will freak out and the market will continue on to new highs and the MACD will cross back into a positive crossover and people will pile on as the market moves higher. Then the permabears will claim the MACD is in a negative divergence position, all the way until the MACD makes a higher high and then and only then will the market be allowed to top. That is hypothetical, but I think it is likely. 2/22/16
Yes, this is a monthly SPX chart. Details discussed above, but the cliff notes version is that when the month closes with the 12MA below the 20MA, that's strong indicator of a bear market. Look at past examples in '01 and '08. Only valid at month close, however. Currently the 12 is below the 20, but doesn't matter unless we close the month that way. 3/11/16
 moneymiser21