View: VXN QQQ 2 hoursc.png
VXN QQQ 2 hoursc.png
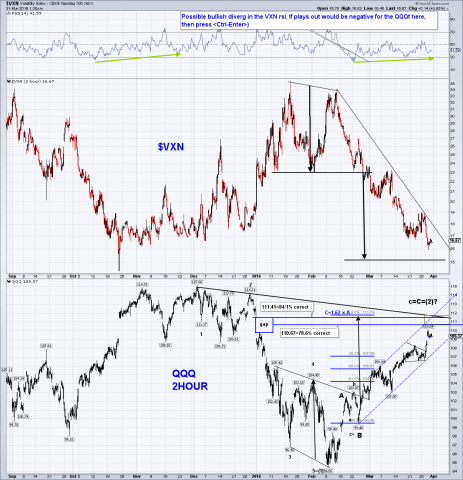
QQQ correction about over? I think likely. Here is the 2 hour chart of the $VXN (volatility for the QQQ) vs the QQQ. 1. The projected targets (black arrows) for the "M" top in the VXN and "W" bottom in the QQQ are close. 2. QQQ price is approaching the longer term downtrend line. 3. The fib 78.6% and 84.1% levels of correction are at the nasty gap nobody (I guess) likes to see and price seems to always close. 4. There appears to possible be developing a bullish divergence in the VXN RSI which if it continues would be negative for stocks. 5. If you like EWT at all (if you don't ignore this) then it looks like the initial down action is a pretty good 5 waves down which usually implies now down action after a correction. All of this puts a target at about 110.5-112. Will be watching there for signs of reversal. Take care. Tom B
 Tomb
Tomb


