Log In
|
Create Account
Chart
AI Chart Analysis
Chart Lab
Drawn Objects ➟
Earnings Reactions
Guide to Patterns ➟
Modes ➟
Power Features ➟
Rotation Graphs
SlopeCharts
Yield Curve
Equities
Biggest Stocks
Calendar of Earnings
Correlations
Earnings ➟
Historical Earnings
Market Capitalization
Power Screener
Super Summary
Volume/Price Leaders
Woulda Shoulda
Markets
CryptoStream LIVE
Economic Database
Global Economics
Heatmap
Macroeconomics
Market Meter
MetaSymbols
Quad Matrix
SlopeRules
Watch Lists
Options
Analytics ➟
Backtest Strategies
Earnings Calendar
Extreme Options
Historical Charts
Matrix of Volatility
Open Interest & Volume
Payoff Analyzer
Strategy Explorer
Volatility Calendar
Read
Automatic Reports
Best Posts of All Time
Books by Tim Knight
Guide to Comments
Latest Posts
Mobile Apps
Profile of Your Host
Recommended Books
Ticker Stripper
Trading Rules
Social
Browse Chart Database
Comments Search
Hall of Fame
Members Directory
Publishing/Subscribing
Recent Activity
Search SlopeRules
Shared Labels & Lists
SlopeTalk LIVE
Trader’s Diary
Help
Best Pages for You
Charts Overview
Guide to the Site
Membership Levels
Pattern Video Library
Power Screener Guide
Premium Memberships
SlopeCharts Reference
SlopeCharts Videos
Video Tutorial
Log In
Create Free Account
Memberships
View: 009 vxo.png
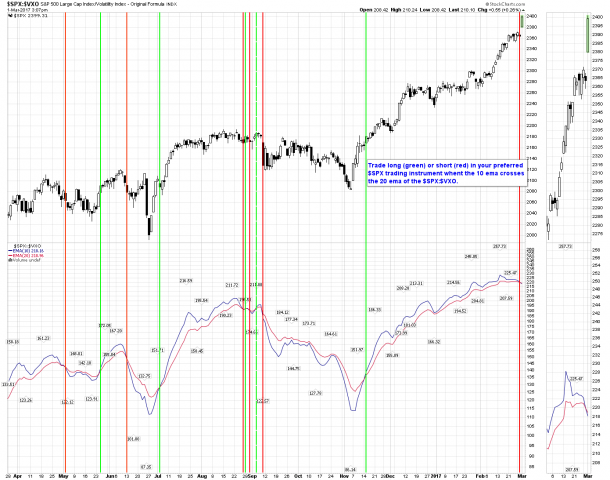
009 vxo.png
I always watch this chart. It says be very wary.
See Full Size
Comments
Just Another Guy
There are so many warning signals out there it's become comical. And day after day nothing changes. Nothing means anything anymore except BTFD.
3/1/17
Gonnabesick
Then that IS the signal.
3/1/17
Just Another Guy
You have no idea how much I want that to be true.
3/1/17
Claws AI
Looks like the start of an island top.
3/1/17
jonnievega
This is fantastic,..if true.
3/1/17
...
Actions
Tweet
Facebook
Stacks
Indicators
Posted
By:
BIGOLDED
On:
3/1/17 12:12PM
Statistics
Viewed by 43 SocialTraders
Average rating based on 2 responses:
Rated By
 Just Another Guy