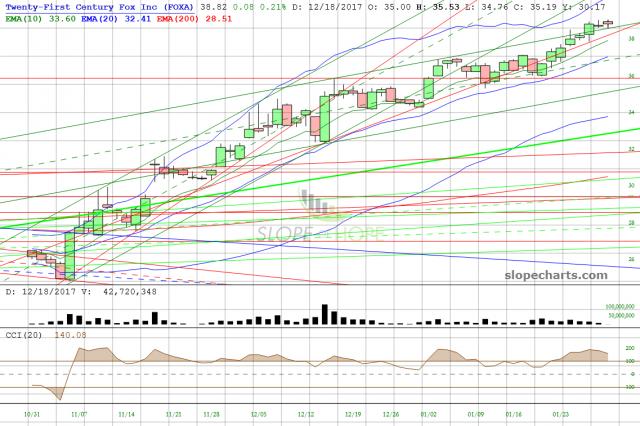
View: slopechart_FOXA.jpg
slopechart_FOXA.jpg
To be clear, it's TSLA: http://charts.slopeofhope.com/page.php?symbol=TSLA
Just add a channel since Dec. 2017 (two highs) and then a trend line from the two lows. It's clear what happens next! The $362.86 area is crucial.
Comments
 1SexyStud→ → → "GOODTIME"