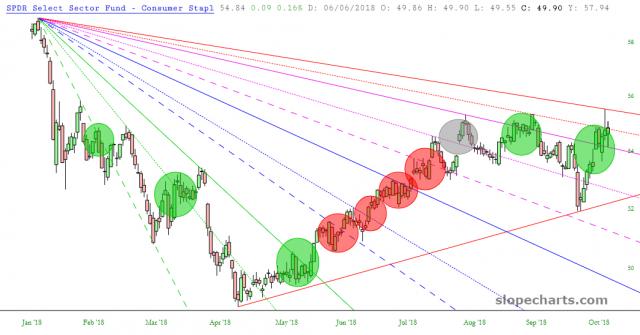
View: slopechart_XLP.jpg
slopechart_XLP.jpg
A little study on trendlines. I set it up on this @$50 stock with the notion of entering short on the second touch of a bearish trendline with the intention of either making or losing $100 (100 lot). The results are inconclusive. 5 winners and 4 losers with 1 negated when price gapped up over the trendline. My conclusion is that entering a trade based solely on trendline second touches is reckless. However in conjunction with other factors, such as horizontal support/resistance lines and candlestick patterns it is worth consideration.
Comments
 stopar1
I think the trend lines are just stretched dots of connected ticks - individual blips of human emotion printed in black and white doji (I) walking electrolytic sacks~~~~ wave receivers~~~~ some waves print through time.
Beautiful moon again tonight