User: MississippiMan: Support and Resistance
slopechart_$COMPQ.jpg
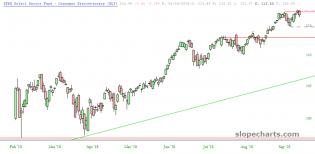
a couple of decent supports under current price
three point trendline and 4 point resistance turned support horizontal

slopechart_FDVV.jpg
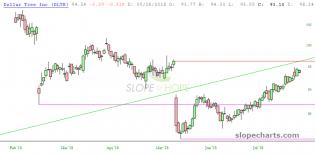
bet the house long when it drops back to 38.50
2
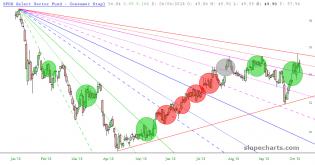
slopechart_EWN.jpg
A definite short candidate with the right candle setup.
1
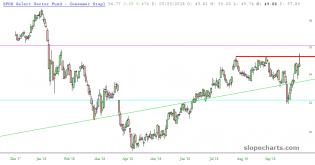
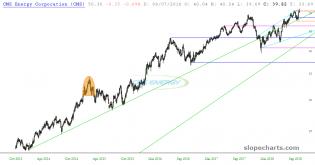
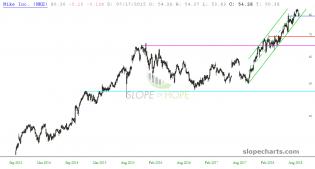
slopechart_CVX.jpg
4th test of resistance
slopechart_TJX.jpg
slopechart_SBGI.jpg
A terrible Friday as the bullish breakout from a few weeks back was once again lost. I thought it looked bullish w...
slopechart_RCL.jpg
Short term triangle breakdown.
Conservative short target 82.50
Longer term short targets orange horizontal and c...
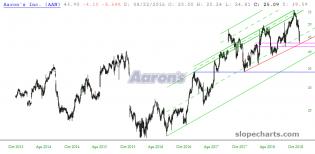
slopechart_AAXN.jpg
Testing long term horizontal after falling below shorter term support horizontal.
slopechart_AMCR.jpg
Buying opportunity for bulls.
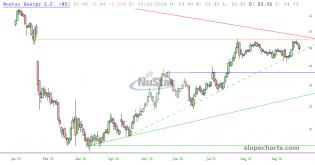
slopechart_SRLP.jpg
Bullish horizontal breakout with successful test.
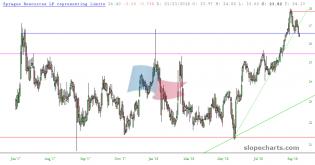
slopechart_IPG.jpg
Bullish breakout. Would be more interested if we get a drop back to test the horizontal.
slopechart_DG.jpg
Looking for support at old channel top.
slopechart_BIG.jpg
The breakout didn't hold and has fallen back below both horizontals. Today's harami suggests a momentum halt to th...
slopechart_WHR.jpg
Finding temporary support here.
3
slopechart_UVV.jpg
Could be finding support here.
slopechart_SWK.jpg
Holding the multi year breakout so far.
1
slopechart_PTON.jpg
Old high holding as support so far.
slopechart_MKC.jpg
Bounced off horizontal support today.
slopechart_TLT.jpg
Major support almost reached on TLT.
1
slopechart_NSC.jpg
looks like another ATH attempt
slopechart_EMB.jpg
looks like a head fake with broken channel to the downside followed by an immediate bounce back higher to the chan...
slopechart_EIDO.jpg
trying to power through horizontal resistance
slopechart_ADBE.jpg
wow
almost 10% in a day
I'd call that a bullish horizontal breakout
slopechart_MSFT.jpg
bullish horizontal breakout
slopechart_MET.jpg
back on the bullish track looks like
slopechart_UTX.jpg
long idea
62 stop
1
slopechart_RMD.jpg
testing breakout of pre-covid high
slopechart_PM.jpg
powerful breakout from pennant and horizontal
measured move to around 86
slopechart_AOBC.jpg
Everybody bought all the guns they need? May be time for a pullback.
slopechart_SNE.jpg
Gopher head spotted! Another ATH.
slopechart_ABBV.jpg
Not really a cup and handle. The circle is where a handle was forming when covid hit. In any case, the horizontal...
slopechart_CHD.jpg
ALL TIME HIGH
2
slopechart_REG.jpg
Spinning top doji. Price has fallen back once again to the last high fractal that can be turned to support. I expe...
slopechart_INT.jpg
Low risk long if you're looking for an oil and gas play. 23.12 short term stop.
1
slopechart_UPS.jpg
Thinking we get a boost in sympathy with FedEx will be looking to short with the right candle around 115.
slopechart_JBHT.jpg
Prime shorting material here. Who is going to drive through protesters in the streets? Easy stop.
1
slopechart_FAST.jpg
Time for some profit taking perhaps.
slopechart_URI.jpg
3rd touch rejection from trendline.
1
slopechart_CBRL.jpg
Short term bulls would like to see the red horizontal hold as support, while longer term holders need at least the...
slopechart_DG.jpg
Looks like we're about to get another bounce higher after testing the bullish breakout of this rising triangle.
slopechart_MNST.jpg
Bullish breakout and successful test (so far).
slopechart_BLL.jpg
Bullish breakout. Thinking long call spread.
slopechart_TDG.jpg
Think I'll try a 400/425 long call spread. Channel bottom will be my stop. Target will be upper channel boundary....
slopechart_LEA.jpg
Long when and if price moves over last Friday high. Target: 118.50 Stop: close under blue horizontal
1
slopechart_ALV.jpg
Low risk long idea. Stop is a close under blue horizontal.
1
slopechart_INSG.jpg
Classic retrace to breakout. I am long this. Easy stops.
slopechart_AOS.jpg
Price is at top of channel and was repelled from bearish trendline today.
slopechart_DHI.jpg
Bearish engulfing on today's candle.
1
slopechart_PAG.jpg
1
slopechart_R.jpg
Will look for a long position with a bullish candle tomorrow. Stop will be a close under channel support line.
1
slopechart_ATCO.jpg
Long with a close under the blue trendline as a stop.
slopechart_NS.jpg
My charting book says this is a good time to short, just need the right candle.
slopechart_CPB.jpg
If you are bullish this a great time to enter. You can use the blue trendline or the blue horizontal for a stop. N...
slopechart_BOX.jpg
Approaching a 5/5 star shorting opportunity.
slopechart_AAP.jpg
Earnings miss? Bullish!
This could be a shorting opportunity as it opened at 140 and closed at 135. Not exactly...
1
slopechart_$XBD.jpg
What an interesting chart! Bullish breakout "pre-Covid". Bearish breakdown at the "Covid" lows. 2 failed attempts...
slopechart_LEN.jpg
Just keeping an eye on this because it seems like an almost perfect short setup chart-wise.
3
slopechart_T.jpg
If you are looking for 8.75% dividend and a trendline to hold.
1
slopechart_SMG.jpg
Hitting resistance on upper trendline.
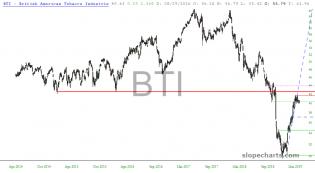
slopechart_BTI.jpg
Short opportunity on retracement of broken overhead support. I will probably buy a 44 put several months out and u...
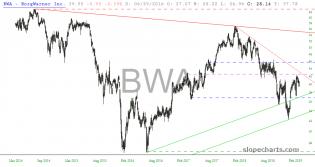
slopechart_BWA.jpg
Rejection from overhead former support
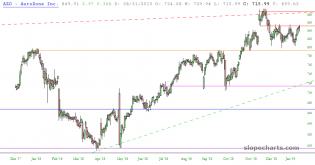
slopechart_AZO.jpg
Looks like it's time for the down move in this sine wave.
1
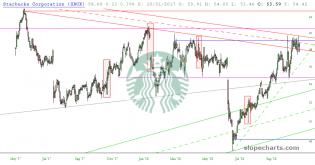
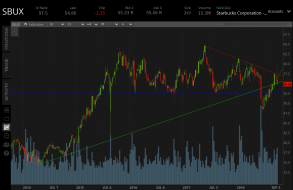
slopechart_SBUX.jpg
Hoping that heroic blue resistance can hold the line and turn back this bull rush. Still short until a close above...
1
slopechart_XLP.jpg
A little study on trendlines. I set it up on this @$50 stock with the notion of entering short on the second touch...
3
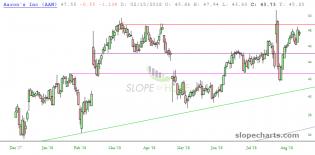
slopechart_AAN.jpg
I HATE to say it, but $AAN could catch a bounce in the next day or two. There is a confluence of support right bel...
2
slopechart_XLP.jpg
Triple top pattern.
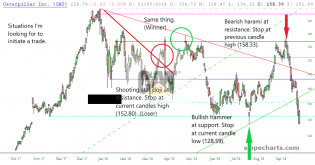
CAT_102218.png
The way I trade currently.
2
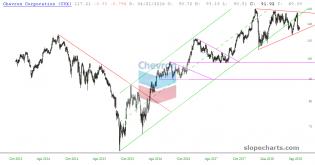
slopechart_CVX.jpg
Something to keep an eye on. Leaning bearish but waiting on break of lower red triangle support. Stop will be clos...
1
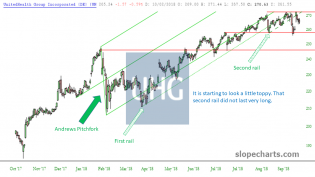
UNH_101918.png
Various chart art of a stock that seems to only know one direction. No directional bias from me, yet. So far on th...
1
SBUX_triangle.png
Buying Nov16 57.5-52.5 put spread for for 2.50 if I can get filled in the morning.
1
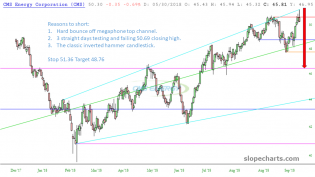
CMS_101018.png
Gotta go short!
slopechart_CMS.jpg
5Y daily CMS
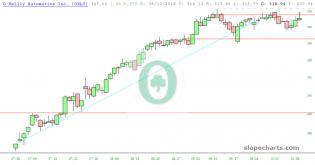
slopechart_ORLY.jpg
Bought $ORLY Oct19 350-340 put spread -4.60 calling a triple top.
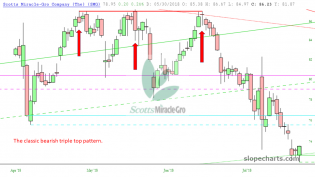
SMG_TT.png
Triple top reversal.
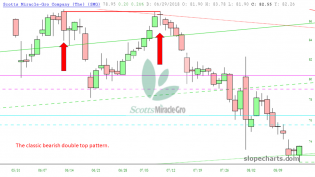
SMG_DT.png
Double top reversal.
slopechart_SRLP.jpg
Short. 27.40 stop. 25.50 target.
slopechart_NS.jpg
Double top, descending bearish red trendline, just waiting for that ascending green dashed trendline to be pierced...
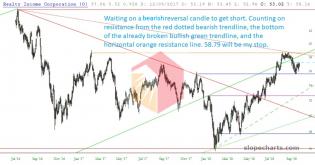
slopechart_O_100718.jpg
Another short idea in the realty sector.

RDN_100718.png
H&S Watch, as opposed to a H&S warning. Still playing with Powerpoint.
VTR_PNG.png
Health care and real estate short in one. Testing powerpoint use in editing charts.
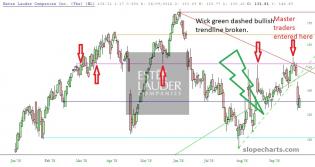
slopechart_EL_trendwick_100618.jpg
Missed chances.
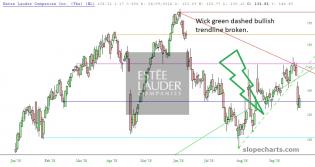
slopechart_EL_trendwick_100618.jpg
Trendline using wicks.
1
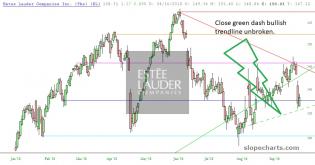
slopechart_EL_trendclose_100618.jpg
Trendline using closes.
2

slopechart_NKE_100518.jpg
A closer look at NKE.
2
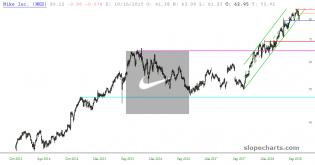
slopechart_NKE.jpg
A bounce to 83.50 after this trendline break down to 75 would be my ideal continuation.
1
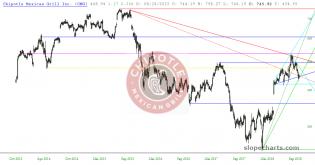
slopechart_CMG.jpg
All kinds of interesting things going on here in $CMG. I think I would get short if 476.28 (yellow line) is retak...
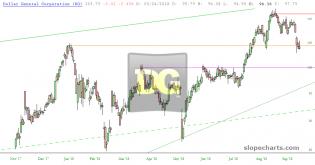
slopechart_DG.jpg
Would like to see a retrace back to 107 to get short. However if price drops immediately below 102.88 I would cons...
1
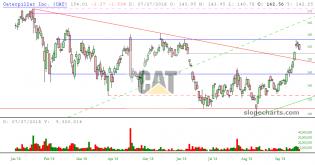
slopechart_CAT.jpg
Looking at a bounce off of 158 blue resistance line. Target is top side of descending red channel. Stop 158.
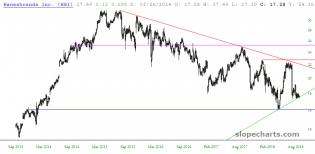
slopechart_HBI.jpg
Long Monday stop at 16.10
slopechart_XLY.jpg
Yesterday's candle completed a NR7 pattern. Purple dashes are the range. A close above or below is the signal to o...
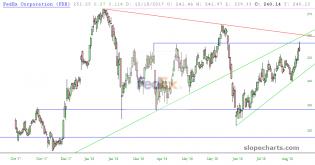
slopechart_FDX.jpg
3 different forces at work to push price down.
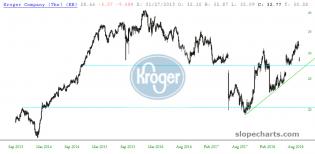
slopechart_KR.jpg
Earnings drop. Should find support @ 27.50
1
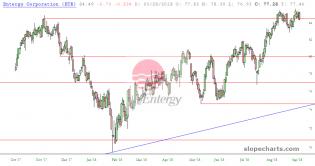
slopechart_ETR.jpg
If your looking for a utility short Entergy just had a double top and an engulfing bearish candle. Stop at 86.
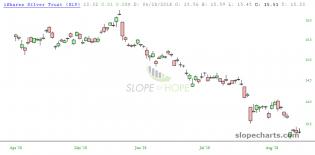
slopechart_SLV.jpg
SLV hovering around 5 year lows. Thinking of selling 13 puts tomorrow. Comments or advice welcome.
1
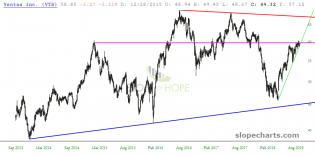
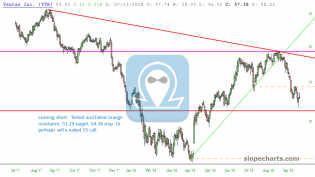
slopechart_VTR.jpg
Will be looking for a break below the green trendline to get short for a swing trade.
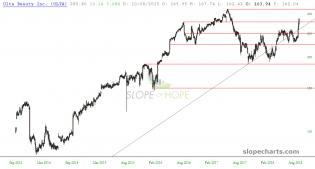
slopechart_ULTA.jpg
Next stop 313? Jeez
1
slopechart_NKE.jpg
Let's see if that blue or green line acts as support.
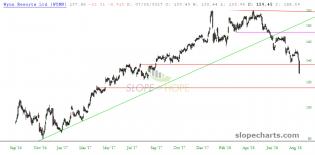
slopechart_WYNN.jpg
Yikes!
2
slopechart_DLTR.jpg
Shortable via credit call spread.
slopechart_AAN.jpg
Shortable. Target 45.