View: slopechart_WMT.jpg

slopechart_WMT.jpg

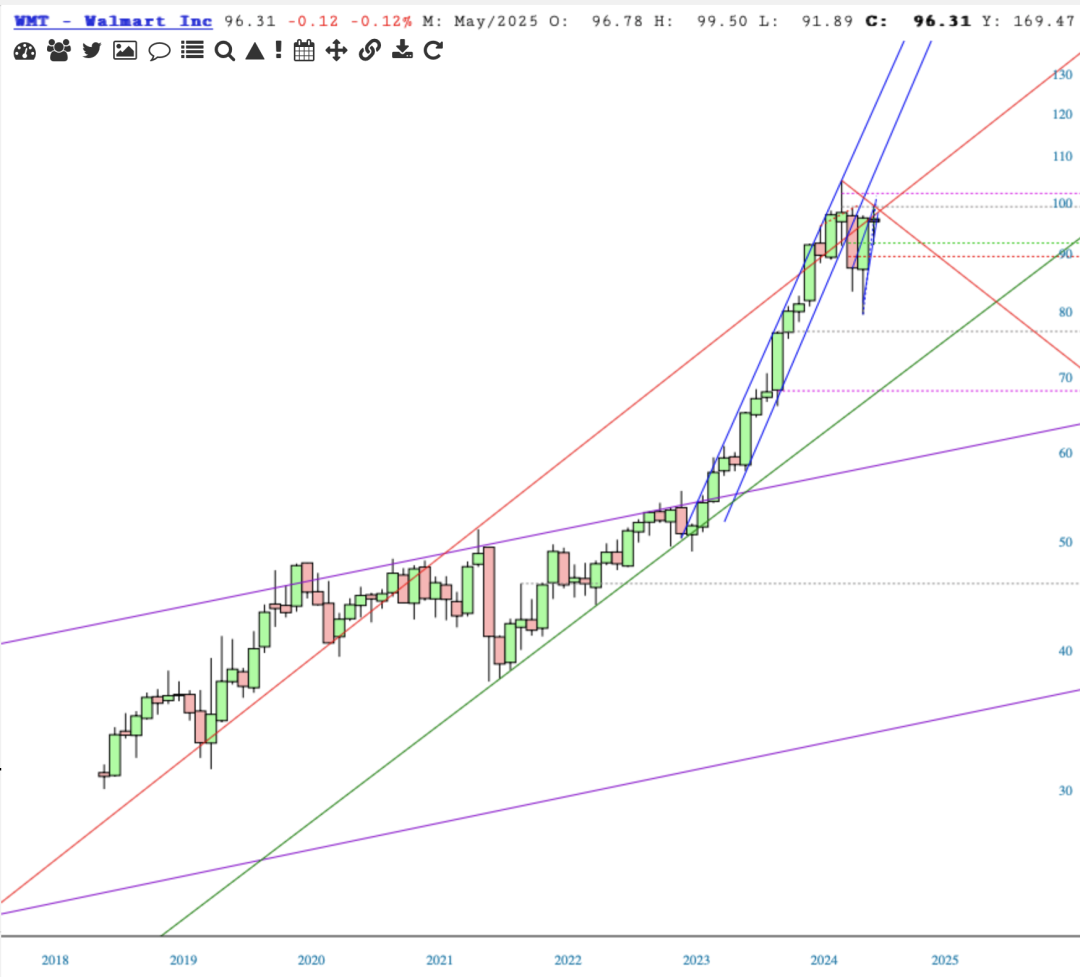
WMT topped in Feb of this year and while its effort to win back that loss have been strong, four times price has been unable to get past the horizontal resistance I've put at 99.28. 
Next support is about 92.15, the top of the Ichimoku Cloud.

Image added via SlopeCharts
slopechart_WMT.jpg

Comments

VioletViolet
5/21/25
Cool_BeansCool_Beans
Noticed your WMT post. Just adding my chart to your find...Best to you and your trade. 
 
5/21/25
Mr. WizardMr. Wizard
I just did a Slopecharts ratio analysis of COST vs WMT. It simply hadn't occurred to me before. 
 
Walmart outperformed until 1992, then they switched for 5 years with Costco outperforming, then back again in Walmart's favor. 
Then it went back to Costco, where the edge has stayed for the past 22 years. Over that time Costco has outperformed Walmart by 5 to 1. 
 
Incredible. Walmart just can't get out of their own way. Whatever their issues, they just can't break the mindset of a crappy company, with a lot of dumb, apathetic, unhappy employees, selling cheap stuff to poor people. 5/21/25
...