Browse Symbol Stacks: WMT
slopechart_WMT.jpg
WMT - Many green lines and a wedge.
Earning 19Feb before the bell.

3
slopechart_WMT.jpg
WMT printed Three Black Crows pattern, a bearish reversal of the upward price trend.
According to Bulkowski, "a...
slopechart_WMT.jpg
WMT Diamond...?
slopechart_WMT.jpg
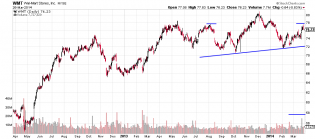
WMT topped in Feb of this year and while its effort to win back that loss have been strong, four times price has b...
3
slopechart_WMT.jpg
Watch WMT: huge weekly candle, but today, so far, doji may indicate turnaround and shorting op.
slopechart_WMT.jpg
WMT chart speaks for itself.
slopechart_WMT.jpg
WMT - So far, so good. Backtesting bottom of the channel.
slopechart_WMT.jpg
WMT - Strike one. Strike two, you are Out.
Do note how thin the Cloud is (red & green horizontals) and its position...
1
slopechart_COST,WMT,PG,XLP.jpg
spot the outlier

2
slopechart_WMT.jpg
WMT getting a bit ahead of itself? PE of 40 seems a bit rich...

1
slopechart_WMT.jpg
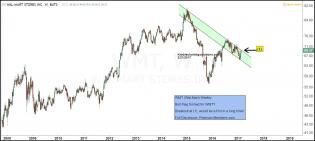
pre earnings wedge
2
slopechart_WMT.jpg
WMT - Two lost trendlines from 1974.
1
slopechart_WMT.jpg
Does not look like WMT can save itself.
Dotted red TLs are from 1974.
Blue TLs are from 1999 and 2015.
2
slopechart_WMT.jpg
If WMT holds this 133 support level, the next best time to short is after retest of the bottom of the green trendline...
4
slopechart_WMT.jpg
Hanging around a top to bottom channel support.

slopechart_WMT.jpg
Monthly chart of WMT.
Bottom of Cloud is the dashed purple horizontal.
Green uptrend is from 1974.
3
slopechart_WMT.jpg
May run into next months earnings

slopechart_WMT.jpg
Got a little ahead of itself
slopechart_WMT.jpg
Boom
slopechart_WMT.jpg
wmt-potential-bull-flag-pattern-breakout-in-play-feb-21.jpg (1501×675)
Walmart and its channel

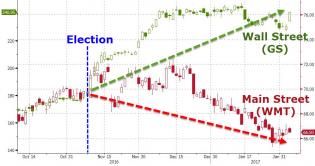
20170204_wall.jpg (964×510)
A bit of a divergence
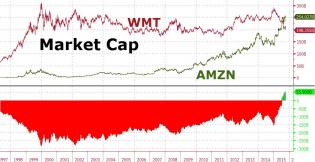
20151014_wmt3.jpg (961×495)
Amazon now substantially bigger market cap than WalMart - amazing!
1
WMT

wmt.png
WMT: Wal-mart Head Shoulders Top prices are falling so is your stock.

5
retail6packcloselooknov211.jpg (1561×710)
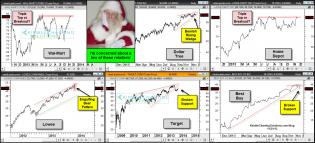
Hey Santa….I’m concerned about what I see in Retail!
market-cap-percent-spx1.png (555×474)
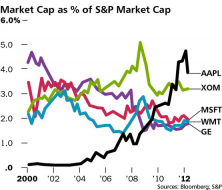
5 Biggest Market Caps As % of S&P500
1
wmt short.png
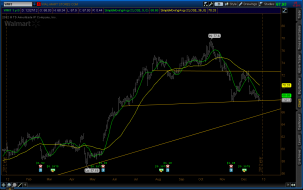
Shorted wmt from 72 to 68 thanks tim!
bounce? or go on through?
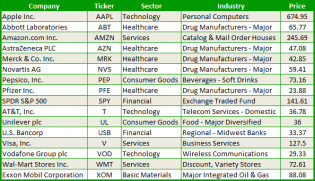
16 Defensive Stock Plays

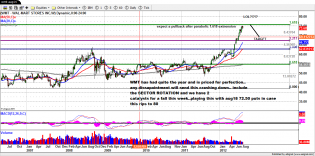
wmt aug14.png
end of weekly wave 5? earnings and sector rotation catalysts... potential for huge dowside... momentum has been we...