View: Calculated Risk: ATA Trucking index declined 1.1% in April
Calculated Risk: ATA Trucking index declined 1.1% in April
by CalculatedRisk on 5/22/2012 05:31:00 PM
From ATA: ATA Truck Tonnage Fell 1.1% in April
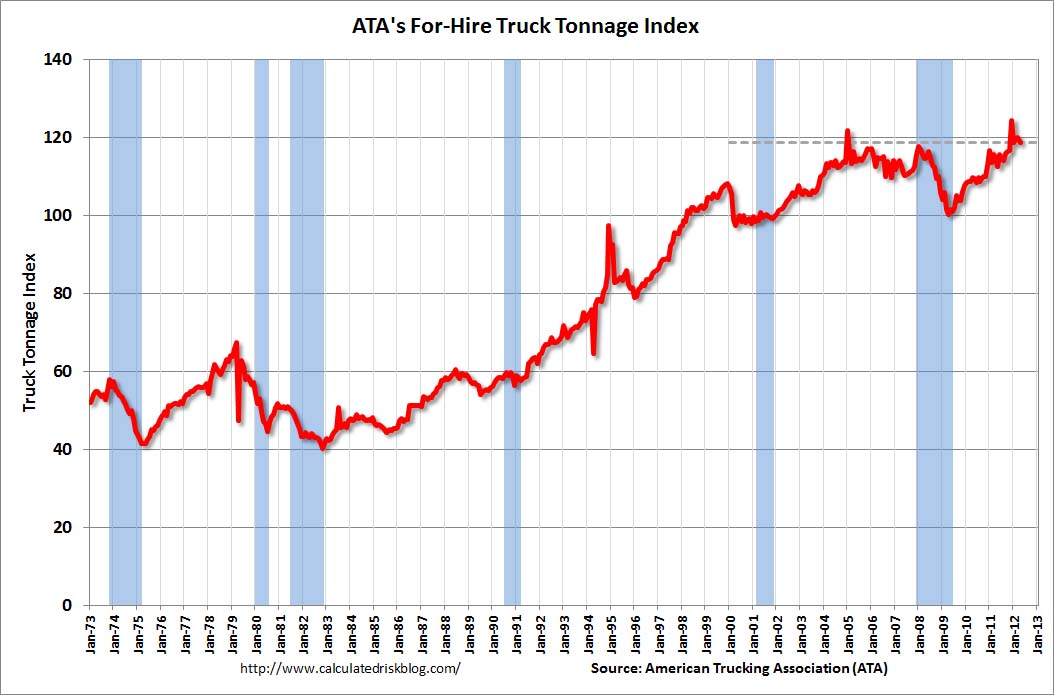
The American Trucking Associations’ advanced seasonally adjusted (SA) For-Hire Truck Tonnage Index decreased 1.1% in April after increasing 0.6% in March. (March’s gain was more than the preliminary 0.2% increase ATA reported on April 24.) The latest drop put the SA index at 118.7 (2000=100), down from March’s level of 120. Compared with April 2011, the SA index was up 3.5%, better than March’s 3.1% increase. Year-to-date, compared with the same period last year, tonnage was up 3.8%....“While April’s decrease was a little disappointing, the March gain turned out to be stronger than originally thought,” ATA Chief Economist Bob Costello said. “The ups and downs so far this year are similar to other economic indicators.”“While just one month, the April’s decrease also matches with an economy that is likely to grow slightly slower in the second quarter than in the first quarter,” he said. Costello reiterated last month’s noting that the industry should not expect the rate of growth seen over the last couple of years, when tonnage grew 5.8% in both 2010 and 2011. “I continue to expect tonnage to moderate from the pace over the last two years. Annualized growth in the 3% to 3.9% seems more likely.”
 Click on graph for larger image.
Here is a long term graph that shows ATA's For-Hire Truck Tonnage index.
The dashed line is the current level of the index. The index is above the pre-recession level and up 3.5% year-over-year.
From ATA:
Trucking serves as a barometer of the U.S. economy, representing 67.2% of tonnage carried by all modes of domestic freight transportation, including manufactured and retail goods. Trucks hauled 9 billion tons of freight in 2010. Motor carriers collected $563.4 billion, or 81.2% of total revenue earned by all transport modes.Earlier on existing home sales:
•
Existing Home Sales in April: 4.62 million SAAR, 6.6 months of supply•
Existing Home Sales: Inventory and NSA Sales Graph•
Existing Home Sales graphsComments
No comments yet.

