Browse Stacks: Analytics: Analogs
bfm62C9.jpg (1041×695)
From Zerohedge (of course). Are you fucking KIDDING me?

1
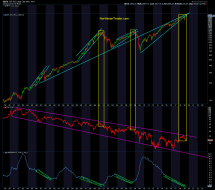
ubs short iundex.jpeg (432×288)
SHORT SQUEEZE analog
f48d2459c7dfe1d846f2cc5cf519570b.png (1681×959)
The permabull nut-jobs at Zerohedge are actually suggesting a 1997 analog. Yeah, guys, fine.
3
spx vs lagged.jpg (936×529)
nvda vs csco.jpg (936×522)
image-194-1024x588.jpg (1024×588)
bfmACC1_0.gif (736×393)
Inflation is going to go ape shit
3
bfm921.jpg (936×597)
This is so goddamned stupid.
1
bfm55D_2.jpg (921×522)
1
bfmD808.jpg (969×589)
2
ggg.png

zferg.png
Hey I've found it, calling XIV a bubble on Jan 5 2018
The top was Jan 11th
One of my most precise (and accurate...
1
slopechart_XBI.jpg
guess the next move

1
slopechart_SPY.jpg
so far, so good
slopechart_$RUT.jpg
so far, so good
slopechart_$RUT.jpg
Will we get an analog? 200 points of room
1
F1qBup0XsAEhnZA (1179×743)
slopechart_IYR.jpg
Getting there...?
RGEG (1).png
American now and then
slopechart_SPY.jpg
Spyanalog
1JUN20.png
French luxury stocks acting as a leading indicator for big tech?
1JUN19.png
End of an era precursor?
slopechart_CVNA.jpg
will we see a repeat of the cup overfloweth pattern? it may put a fork in it
2
3JUN18.jpg
bfmCF8A.jpg (1016×569)
slopechart_BILL.jpg
Beautiful
mr7hso3y8n6a1.jpg (640×661)
4
2022-10-21_09-51-47.jpg (975×617)
1
nwhenqllk9o91.png (1313×518)
2022-09-13_12-52-33.jpg (976×532)
2
2022-05-18_11-51-46.jpg (990×664)
1
slopechart_CROX.jpg
Stinky shoe analog
1
slopechart_$SPX.jpg
1929 Analog
slopechart_DKS.jpg
Beautiful analogs
2008-Bear-Market-Analogy-031522.png (856×505)
MS 2018 price analog.jpg (745×489)
slopechart_layered.jpg
Layered chart of IYR Covid and 2022 analog
2
slopechart_layered.jpg
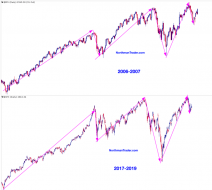
Here is the S&P from the late 1990s and then recent history, overlaid by way of Layered Charts.
3
90lbu3ec0yi81.jpg (538×392)
3
2022-02-14_13-10-54.jpg (956×568)
1
slopechart_TLT.jpg
(Manual) TLT Fib projection onto the Dec high, target 120
slopechart_HAS.jpg
If Hasbro is an indicator of what is to come -- wow -- watch out! --Look at that Analog!
slopechart_KO.jpg
Analog on Coke, if that second line cracks - oopsy - drink water it is near free.
1
82ziyubno7d81.png (2880×1800)
2
slopechart_RH.jpg
bfm7AFF.jpg (986×625)
This must be the shittiest analog I've ever seen in my life.
1
2021-10-28_9-42-39.jpg (1280×651)
Lines up with my analog.
FBtbhD-XMBUVGmK.jpg (1280×824)
BTC and Gold
bfm98FC.jpg (1015×570)
3
bfm54CF.jpg (1015×573)
1
slopechart_$BTC.jpg

bfm46D3.jpg (973×581)
Most recently, in early 2020, credit sniffed out issues while stocks just ignored the fact that a global pandemic...
bfm9326.jpg (1009×580)
2
slopechart_$DOGE.jpg
And the doggy looks like it wants to do another 50 days wrapped around the .38 Fib. Or maybe just crash.
slopechart_$SPX.jpg
Practicing nice charts after an e-mail to Tim. The customer service around here is beautiful!
Not an original i...
slopechart_HOPE.jpg
Interesting analog, if not exactly the same.

bofa 3.jpg (754×414)
1
bfm765.jpg (878×489)
1
5xu5jnpeyow51.jpg (828×461)
2
bfmA267.jpg (1010×536)
1
bfmDE2E.jpg (1021×569)
1
bfmA899.jpg (936×502)
2
2020-07-22.png (1029×1268)
Post-July magic
1
download_41.png (508×320)
1
slopechart_/ES.jpg
Last time at this level, we had a nice puke, let's repeat that
slopechart_IFF.jpg
Analog possible with bullish breakout.
2020-05-14 (2).png (693×608)
stock fall further.jpg (750×500)
Lehman-vs-COVID-041020.png (793×539)
S&P Repeating 2000 & 2007 Patterns Almost Exactly? | Kimble Char...
2
bfmF897.jpg (976×507)
1929 and Today
3
slopechart_$SPX.jpg
Just a blip... so far

bfmB907_0_0.jpg (800×416)
1
5 feb14.PNG
1 feb14.PNG
1
bfmC772.jpg (976×510)
2
bfmB406.jpg (976×973)
1
bfm4D3C.jpg (976×509)
2
bfm9E12.jpg (1280×661)
SP500-AsymmetricBubbles-010820.png (822×758)
2019-12-29_9-44-42.jpg
(Intense)
Jan 17 v. Dec 19 Analog, notice also how ES is currently testing the Dec 18 rally trendline.

1
bfmF76E_0.jpg (976×505)
slopechart_SBUX.jpg
Really ugly pattern on SBUX, but a potential analog - BTFD?
slopechart_CAT.jpg
This analog on CAT may be a bit of a stretch, but if it repeats, CAT should exhaust the up move at the 78.6% Fib l...
slopechart_SLX.jpg

1
spx-divergenes-similar-to-2000-and-2007-aug-23.jpg (1888×913)
2
1 aug29.PNG
slopechart_MDY.jpg
Mid-caps big picture
slopechart_SPY.jpg

1
bfmCB1E.jpg (976×466)
1998 analog

Install Bookmarklet – Slope of Hope

slopechart_MDY.jpg
MidCap Memories
1
slopechart_MDY.jpg
Mid-Caps analog
bfm1A70.jpg (915×511)
1
equity bubbles popped by regulations_0.jpg (705×467)

Investing in Chinese Stocks—投资大中华地区股市: The Impeachment Analog
Impeachment Analog

1
SPXM-6_0.png (1240×1092)
topping-1.png (768×686)

slopechart_MDY.jpg
Ideally, the 2015 to early 2016 lows would have tagged the center rail for a cleaner analog, but after a while, I...
1

slopechart_CENT.jpg
New Short for Today.