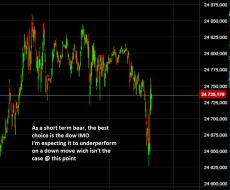
Browse Stacks: Analytics: Seasonality
3874678481a8183f5d19c599c6de5c63.png (939×677)

SxoQytaNgUBBAA7.jpg (1237×950)
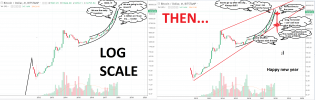
September is comfortably in first place as the worst month of the year for the S&P 500 with an average return of -...
1
aug sept seasonals.jpg (1128×709)
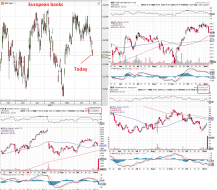
Seasonality isn’t your friend from now til mid-September
1
01a489e8f72b42f514e4f891796fbcc7.png (936×677)
Strong VIX seasonality kicks in soon...
1
0 - 2024-11-26T095010.554_1.jpg (989×590)
Seasonality at play
1
sept is ugly.jpg (1277×622)
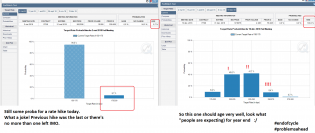
September's second half is a playground for bears - down a whopping 5.7% on average since 2020, without a single S...
2
sept 2nd half worst 2 weeks.png (585×397)
The second half of September is notoriously the worst 2-week period of the year, with stocks historically averagin...
1
6b5452d028ebb45b96682a98e5b8a792.png (937×677)
VIX has strong seasonality from here until early October.
Capture d'écran 2024-01-22 033551.png
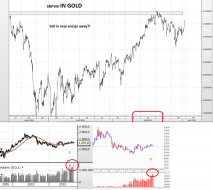
Some food for bears

image024 (2).jpg (592×738)
August’s past and ugly seasonality...
slopechart_$INDU.jpg
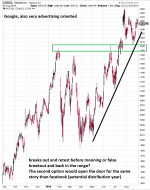
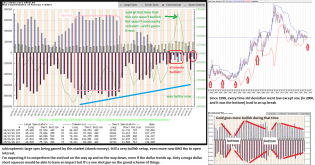
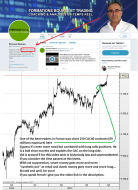
I saw this idea expressed in a YouTube video a while back and went after illustrating it in my own fashion for gig...

slopechart_UNG.jpg
Natty still strong. Signs of a cold winter in many places

slopechart_$BTC.jpg
slopechart_$ALGO.jpg
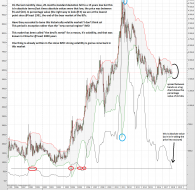
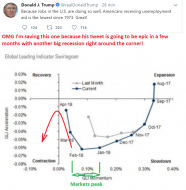
Outside of seasonality, I have not been exposed to the concept of time within technical analysis very often. I gue...
3
RRG_MRO,USO,XOM.jpg

1 Feb9.PNG
5
1 feb21.PNG
5 feb14.PNG
1 feb13.PNG
1 jan16.PNG
3
1 aug29.PNG
spx.jpg
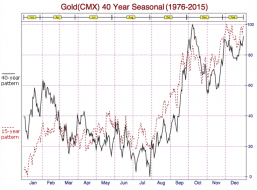
$SPX seasonality.


The Bull Case – NorthmanTrader
Election year seasonality

2
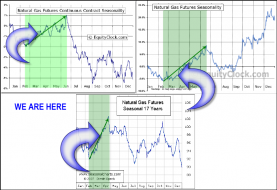
Natural Gas Sets Up Another Buy Opportunity – Technical Traders Ltd.
Natural Gas Bottoming Again

1
2 feb18.PNG
1
9 feb17.PNG
4 feb15.PNG
6

1 Dec30.PNG
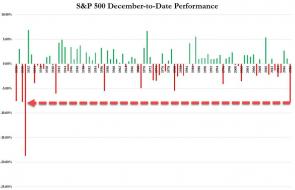
2018-12-18_4-43-16_0.jpg (890×572)
Worst December In 87 Years
3
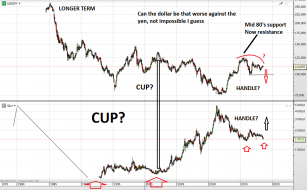
A Post-Powell View of USD, S&P 500 and Gold – Notes From the R...
Sentiment had been flashing bounce before Powell lit the match.


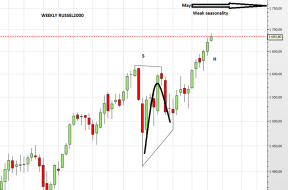
A Man Who Stares at Charts Sees H&S! – Notes From the Rabbit Hole
Man stares at chart, sees upside for balance of 2018 into 2019. Then he sees a nice downside target.
nftrh 526
From Nov. 18th NFTRH... sentiment has been S/T over bearish and looking for a match, but long-term dangerous.
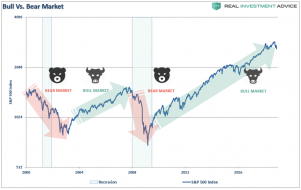
SP500-Bull-Bear-Market-112618-2.png (890×561)
@MS it's suttle. You not so much! LOL
Car Talk: @F and plastic parts: https://www.youtube.com/watch?v=3fn1pu5rP...

1 nov11.PNG
1

slopechart_ORCL.jpg
6 aug31.png
2
5 aug31.png
15 aug16.png
14 aug16.png
9 aug16.png
8 aug16.png

fghhuu.PNG
4
4 aug8.PNG
4 july20.PNG
s3.amazonaws.com/cdn2.soci..._aF1uRy_l.png
RESTACK
btw thx to the poster for that chart

3
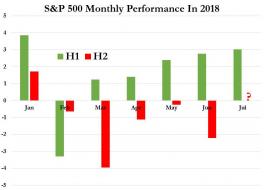
2018-07-16_10-07-05.jpg (789×566)
Up in the first half of every month. Down in the second half. Pretty amazing.
1
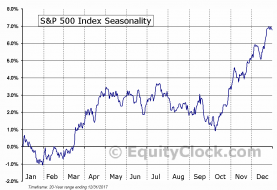
SP500-seasonal.png (911×623)
S&P 500 seasonality
2
slopechart_XRT.jpg
Retail bankruptcies hit an all-time high in the first quarter of 2018, with nearly a dozen prominent U.S. chains f...
2
4 june14.PNG
12 june13.PNG
6 june12.PNG
2
3 june1.PNG
2 june1.PNG
1 june1.PNG
4
3 may31.PNG
1 may30.PNG
8 may23,.PNG
7 may23.PNG
6 may21,.PNG
2 may21.PNG
1 may21.PNG
11 may18.PNG
10 may18,.PNG
5 may18,.PNG
7 may17.PNG
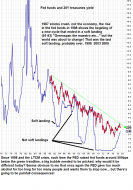
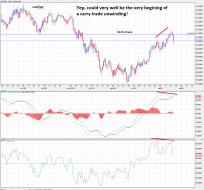
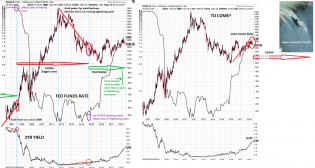
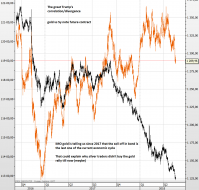
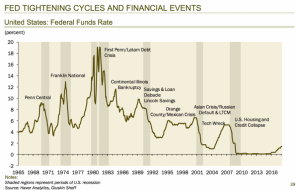
#end of the tightening cycle?
4 may17.PNG
Rosenberg: S&P "Should Be 1000 Points Lower Than It Is Today" |...
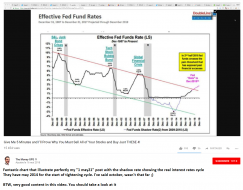
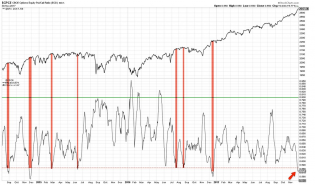
In other words, we are in the middle of the Fed tightening cycle. As history shows, a tightening cycle is almost a...
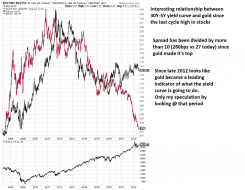
Rosenberg: S&P "Should Be 1000 Points Lower Than It Is Today" |...
As you can see in the chart below, the last two peaks in this ratio almost perfectly coincided with the dot-com cr...
1
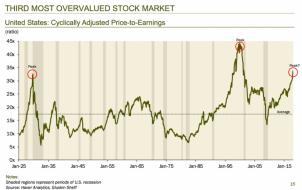
Rosenberg: S&P "Should Be 1000 Points Lower Than It Is Today" |...
For starters, Rosenberg pointed out that only 9% of the time in history have U.S. stocks been so expensive.
2 may5.PNG
4
2 may4.PNG
3
8 may3.PNG
2 may1.PNG

3 apr24.PNG
![2018-04-23_12-39-40[1].jpg](https://s3.amazonaws.com/cdn2.socialtrade.com/st/shards/22332_dlHTZdxd_h)
2018-04-23_12-39-40[1].jpg
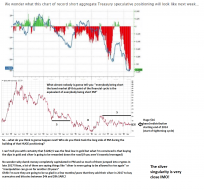
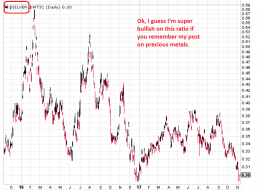
One thing of note - look at the divergence in silver and oil today above - now consider where WTI/Silver is trading...
1
3 apr23.PNG
2
1 apr23.PNG
2
4 apr20.PNG
4
1 apr19.PNG
5 apr18.PNG
5 apr4.PNG
4 apr4.PNG
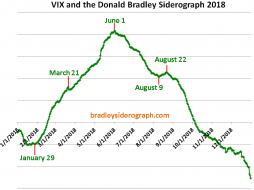
A1-VIX-Bradley-Siderograph-2018-Turn-Dates.png
VIX – 2018 Bradley Siderograph Turn Dates

2

1 feb16.jpg
https://www.youtube.com/watch?v=6WQjgHuUDWU
1
unnamed.png.jpg (786×542)
@PipeSticks yes, when I came down from the Berkley hills carrying tablets, I never thought I would spend almost a...
14
7 jan10.PNG
LOL I love that guy!
Crazy world we are living in, and in a very late cycle stage...soooo much evidences!
3 dec31.PNG
1 dec30.PNG
1
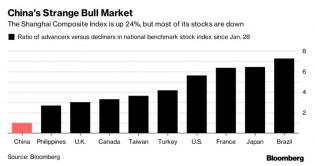
CHINA.jpg
Every bull market is unique, but the one in China right now looks downright strange....the stock market in China i...
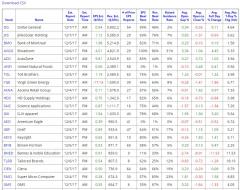
highestREVearningsplayweek.jpg
@DOCSTRANGE, let's get crazy: These are the highest revenue generating companies reporting earnings this week.
1
putcallratio.png
10 day...
3
1 nov8.PNG
Hummmm...
+Sotheby's + automobile few months ago+ commercial properties
economic slowdown coming soon?
1 nov7.PNG
2
4 oct31.PNG
My scenario
2 oct29.PNG
https://www.youtube.com/watch?v=0ofr9o_WjM8
4
$SPXsupertrends.jpg
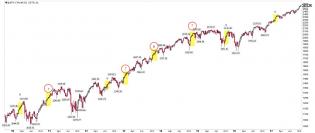
$SPX up 7 weeks in a row. Up 8 weeks just once since 2003; gained 0.06%. Up 9 weeks at start of 2003-07 bull marke...

spectrumbrands.jpg
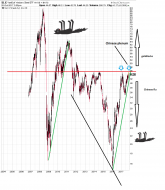
Spectrum Brands $SPB owns Russell Hobbs. It looks like it was on the up this week. Promising MACD. Seasonality als...
6 oct20.PNG
SPXfutures.jpg
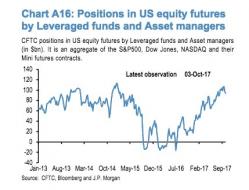
Hedge funds and asset managers haven't been this net long US equity futures since 1Q15
hedgehogs&therutty.jpg
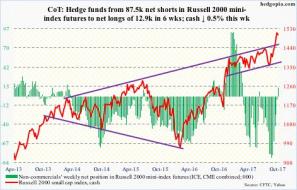
For 1st time in 17 weeks, #hedgefunds net long $RUT futures, even as cash showing signs of fatigue after huge run. $IWM