Browse Stacks: Patterns: Flags
GBPEUR.jpg
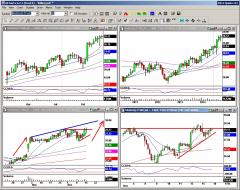
$GBPEUR IH&S on the 1d chart. If you look at the 1h chart you'll see bull flags in quick succession. This is likel...

1
file

slopechart_COG.jpg
bear flag possibility

slopechart_PKG.jpg
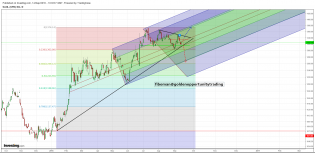
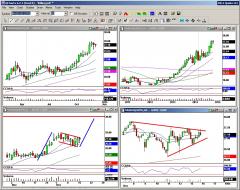
Superb bounce off of the bullish trendline. Combine that with a picture perfect bull flag and you have an excellen...
slopechart_BOX.jpg
Bull flag, gap needs filling, and two prior resistance horizontals conquered. Bullish
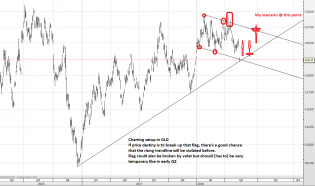
slopechart_GLD.jpg
GLD in a flag since early April. GC very similar.

2
slopechart_LH.jpg
Pennant on pole. Conservative measured move is 34 from breakout point whichever way it breaks. A pennant is generally...
Install Bookmarklet — Slope of Hope
slopechart_PEP.jpg
Last month there was some discussion of bull flags. This is a well formed bull flag (if it breaks up). Conservativ...
2
slopechart_DHR.jpg
The measured move on that bull flag is to @205
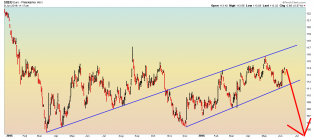
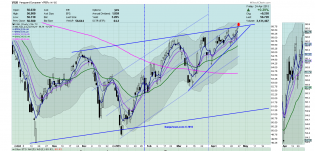
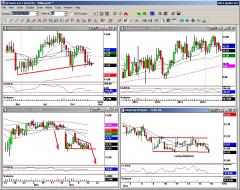
slopechart_$TRAN.jpg
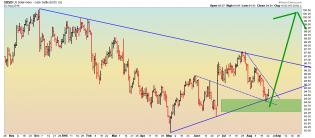
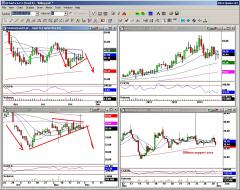
Transportation Index has spent most of the last 3 months in the upper half of a possible bear flag. The green tre...

2
slopechart_RUBY.jpg
slopechart_CDXC.jpg
slopechart_KBAL.jpg
goldsilver.jpg
You could be up 24% today if you buy discounted Talisker's single malt from Tesco.
slopechart_SPY.jpg
1
slopechart_GLPG.jpg
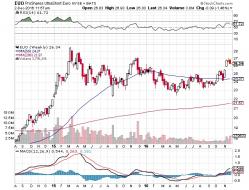
Nice bull flag for this European pharmaceutical.
slopechart_SPY.jpg
SPY 30min chart, two chained flags, next target around 270.23

1
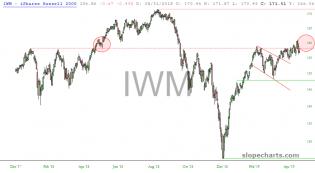
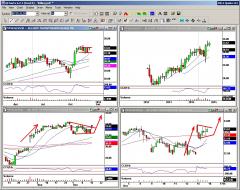
slopechart_IWM.jpg
I would be looking for a similar price pattern in the right circle as the one that appeared in the left circle as...
1
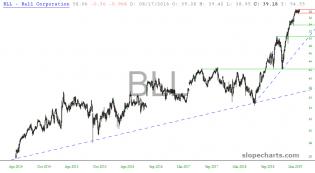
slopechart_BLL.jpg
Bull flag waiting for confirmation.
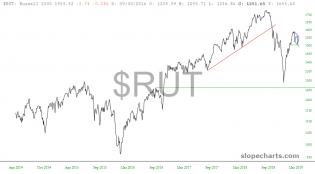
slopechart_$RUT.jpg
If that's a bull flag, the measured move would be around 1900.
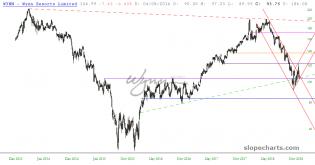
slopechart_WYNN.jpg
I guess we'll find out tomorrow if that's a bear flag or a reversal. It's probably time to draw a new green trendline.
1
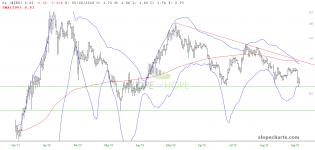
slopechart_$ZRX.jpg
https://www.youtube.com/watch?v=x-lLjyyaMbg

1
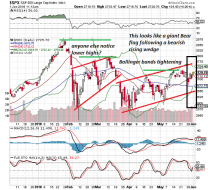
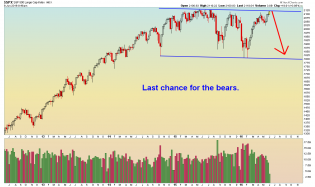
SPX-daily6-1-18.png (550×502)
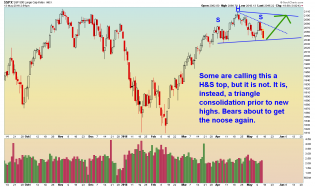
Bear flag in the S&P 500

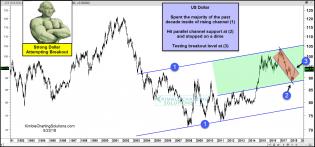
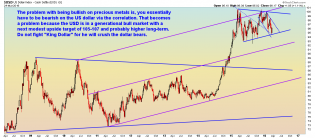
dollar-testing-key-breakout-level-after-recent-rally-may-24.jpg...
"Restack attempt"
ot certain what happened. Tomorrow, I'll try to explain.
RE: SocialTrade comments:
So enjo...
3
5 may16.PNG

2 may15.PNG

index linked gilt.jpg
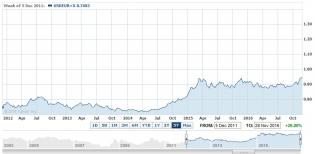
Bull flag standing up out of bull flag on UK's index linked gilt. What's next?
1

hear.jpg
@MovinFwd I think I've spotted a flying dragon. Either that or a flying turtle.
2

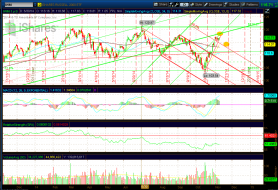
IndexLinkedGilts.jpg
UK iShares Index-Linked Gilts ETF goes up with inflation. Nice bullish flag on the right. As /CL goes up, so does...
weekly markets analysis
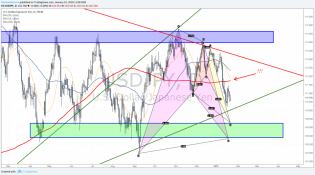
USDJPY - Moving inside Triangle pattern - Two harmonic patterns in focus

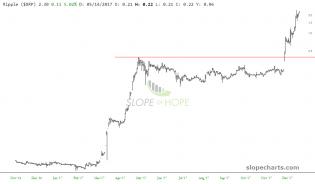
slopechart_$XRP.jpg
Ripple is a superb example of the bullish "flag" pattern - https://www.investopedia.com/stock-analysis/cotd/answ20090...
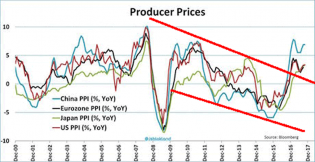
Producer Prices.png
Producer Prices indicate inflation has finally returned.
3
4 nov7.PNG
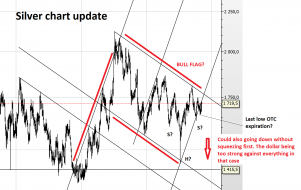
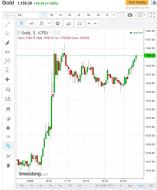
gold.jpg
Bull flag channel formed on spot gold after North Korea's nuclear test. Suspect that S3 pivot will be tested down...
3
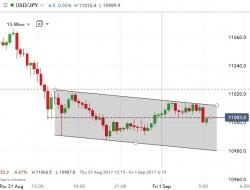
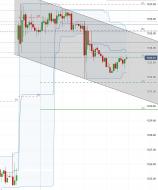
usdjpyshort.jpg
$USDJPY is in a channel on the 15 minute chart. I believe that USDJPY isn't going any higher than the top of this...
3
weekly markets analysis
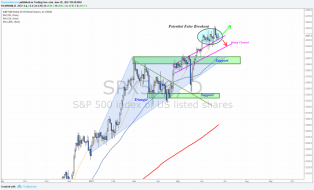
S&P500 with a false breakout signal - Will investors buy this dip? Read more in this week's newsletter
1
click here to enlarge
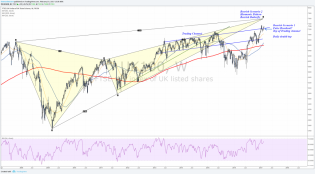
2 bearish scenarios for UK100 in this week's weekly analysis. Also bearish scenarios for German DAX and DIA
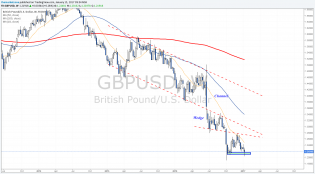
Volatile week ahead for GBP traders - TheMarketZone
1.2 will be tested as support as Theresa May is scheduled to speak. Head and Shoulders pattern in focus
GSK.png
GSK. Flagging above previous support off after bullish divergence with a big gap to fill way above

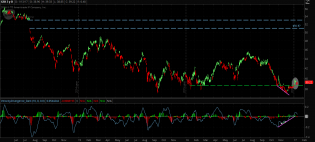
gold.jpg
Update on the daily spot gold chart. Perfect flag. Mostly green climb.
4
gold.jpg
3
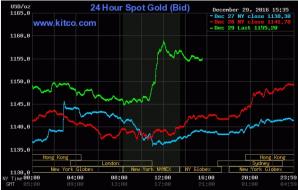
goldH2log.png
Spot gold has been a real tease over the last 36 hours.

3
USDEUR.jpg
Bullish on USDEUR? Doesn't look like a terrible idea.
EUO.jpg
An option to short the Euro this weekend. Interesting weekly chart.
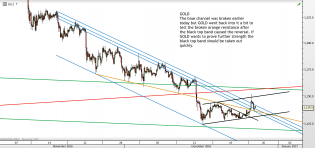
gold (p) 14.09.16.png
Gold:decision pending...

1
USD - Daily - 8.23.16.png
USD - daily chart. This is not investment advice.

1

IBB - Weekly - 8.18.16.png
IBB - weekly chart. This is not investment advice.
1

XLF - Daily - 8.17.16.png
XLF - daily chart. This is not investment advice.
1
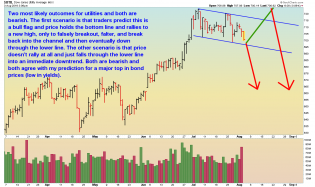
$UTIL - Daily - 8.3.16.png
Utilities - daily. This is not investment advice.
1

VIX - 2 hour - 8.2.16.png
VIX - 2 hour chart. This is not investment advice.
2
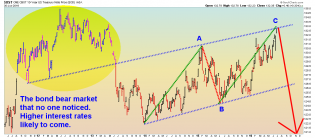
10-Year Bond Price - Weekly - 6.30.16.png
10-year bond price, weekly. This is not investment advice.
1

FXI - Daily - 6.28.16.png
FXI daily. This is not investment advice.
3
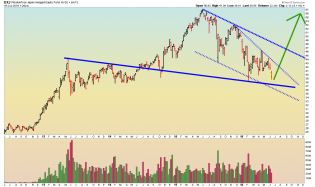
DXJ - Weekly - 6.16.16.png
DXJ weekly. This is not investment advice.
4
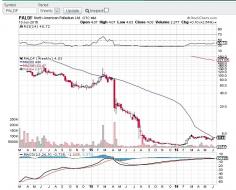
PALDF.jpg
North American Palladium at 50 week moving average
2
Euro - Daily - 6.9.16.png
Euro - daily. This is not investment advice.

USD - Monthly - 6.8.2016.png
USD monthly. This is not investment advice.
3
SPX Weekly - 6.8.16.png
SPX weekly. This is not investment advice.
3

NDX - Daily - 6.6.16.png
NDX Daily. This is not investment advice.
1

Copper - Daily - 6.2.16.png
Copper daily chart. This is not investment advice.
3
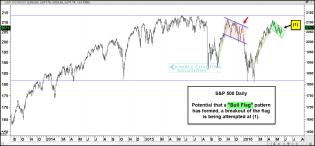
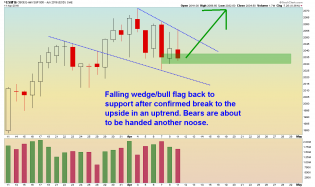
spx-bull-flag-testing-resistance-may-24.jpg (1569×730)
Flag pattern in progress
1
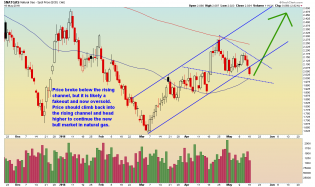
Natural Gas - Daily - 5.17.16.png
Natural Gas daily. This is not investment advice.
2
SPX - Daily - 5.13.16.png
SPX daily. This is not investment advice.
8

VIX - Daily - 5.12.16.png
VIX daily. This is not investment advice.
5
EEM - 4.18.16.png
EEM monthly. This is not investment advice.
2
gold 16.04.16.png
Gold ongoing correction
1
SP_Apr_15.png
Update of a chart first posted in Feb, updated in Mar treating the mid Jan to mid Feb period as an intermediate do...

ES - Daily - 4.11.16.png
ES daily. This is not investment advice.
6
US Dollar - Weekly - 3.24.16.png
US dollar - weekly. This is not investment advice.
1
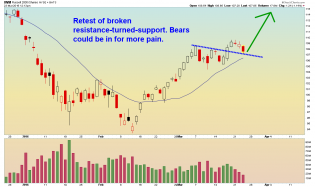
IWM - Daily - 3.23.16.png
IWM daily. This is not investment advice.
Addendum added on 3.29 @ 3:00 pm EST: Massive distribution seen in in...
3
xvg-monthly.png (1966×1196)
Interesting parallel
2
SPX Daily - 2.9.16.png
SPX daily. This is not investment advice.
7
DOW - Weekly 1.27.2016.png
DOW weekly. This is NOT investment advice.
3
China Monthly - 1.11.16.png
China Monthly. This is an opinion.
9
xvg.png (1972×916)
History about to repeat itself again.
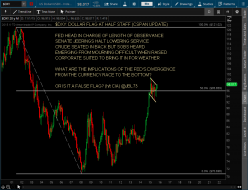
$DXY - FLAG AT HALF STAFF - 11-4-15.png

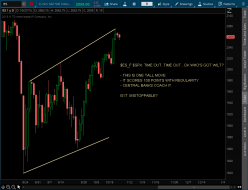
SPX - WHOS GOT WILT - 10-27-15.png
NYA - Weekly 10.26.2015.png
NYSE Composite Weekly. This is an opinion and not investment advice.
8
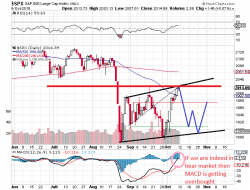
spx3.png
Bear flag
5
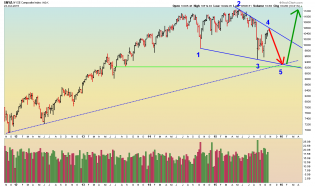
COjqm8vVEAAJ8d9.jpg:large (1024×478)
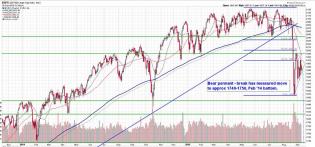
Target of 1750 on the S&P based on this flag
1
The Summer’s carnage in Pictures - Financial... • The Market Zone
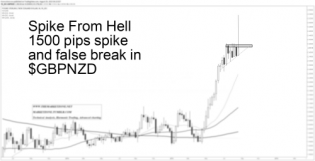
Spike from hell - 1500 pips spike and False Break on $GBPNZD http://goo.gl/G4j0A4 - Summer's price action
sc342.png
QE4????
2
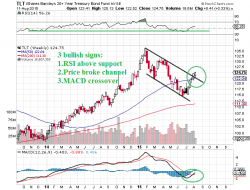
GILD_Weekly_May102015.jpg
I rarely trade bio-tech. But this GILD set-up on the weekly chart screamed at me.
Price (so far) has respected...

Euro_Index.png
VGK, a Euro Index fund, I noticed put in a massive bearish pennant on Friday. Not being confident at all about Eur...

$NXPI first sell
3 great reminders learned from a 20%+ winning stock trade: http://www.morpheustrading.com/blog/3-tips-winning-stocks/


Daily QQQ - 2.1.2015.png
Daily QQQ. This is an opinion. This is not investment advice.
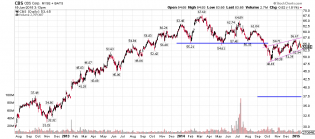
cbs.png
CBS: Now a well defined bear flag to break down and continue toward the gap fill target.

2
Oil_OneHour_FlagBreak_Jan082015.jpg
Behold the power of the crude bears!
Hourly bar just snapped support and bull flag (2pm est)
4
12162014tivo.jpg
short possibility under 11.90 http://tinyurl.com/noc9hzj

12162014alsn.jpg
swing long odds
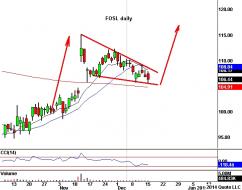
12162014fosl.jpg
http://tinyurl.com/noc9hzj swing long odds
12162014agco.jpg
AGCO http://tinyurl.com/noc9hzj swing long odds
12162014ttwo.jpg
http://tinyurl.com/noc9hzj TTWO long
12162014sonc.jpg
12012014sgen.jpg
12012014crus.jpg
12012014vvus.jpg
iwm.PNG
I like the $RUT because the small caps $VP look to be heading higher

1
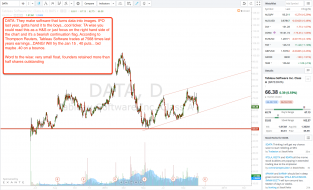
2014-10-16_DATA.png

1
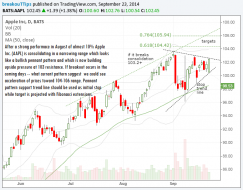
aapl1.png
After a strong performance in August of almost 10% Apple Inc. (AAPL) is consolidating in a narrowing range which l...

1