User: facesincabs: Bubbles
sc.png
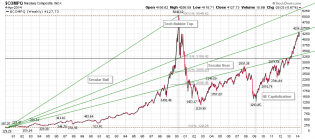
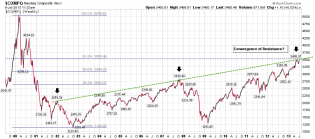
I posted this chart several weeks ago .. so here is an $NDX Chart Update .. 30 years of resistance IS BEING consisten...

sc.png
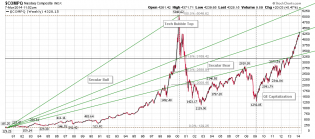
UPDATE .. Watching NASDAQ weekly closing price today .. despite the uber-rally (and extreme pop in bond yields thi...
1

sc.png
UPDATE on NASDAQ 30 year chart .. we tapped the green fib line today .. I am NOT calling a top with this BUT I sti...
2

sc.png
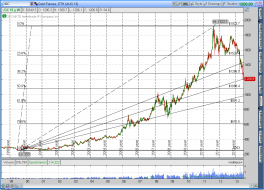
BIG PICTURE .. two decades of the NASDAQ .. getting closer to bubble resistance (weekend warrior chart) ..
1
20140209_long2.png (1238×884)

2
sc.png
While indices look bubbly here, I do NOT expect a decent pull back until we see some BIG volume show up .. MM's ca...
1
sc.png
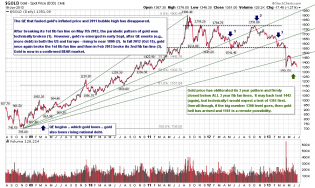
Tech observation and update .. big picture from the bubble pop .. 3 tops have been marked (so far) by the rising u...
5
GC.png
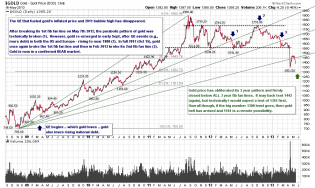
Gold .. here is that 1209 fib line from the 15 year (trend) chart using /GC ..
sc.png
Gold (/GC) has confirmed its 2nd leg down overnight on its 4 year, daily chart .. it is currently hovering this mo...
1
NKD.png
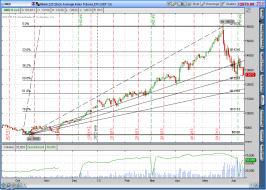
for those interested .. here is why I think that the $NIKK levels are important going into the weekend .. it is pr...
2
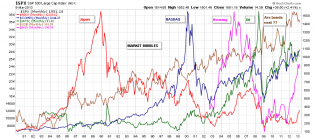
bubble.png
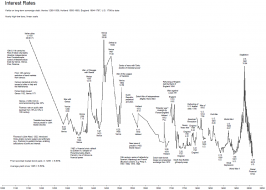
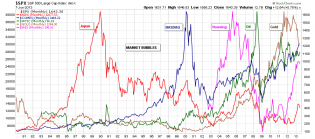
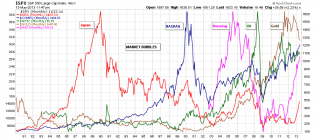
Just to provide some context to my last chart .. here is map of bubbles (and their bear markets) over the last 30...
sc.png
Gold Short Term .. I am looking for a test of 1351 area .. many tried to catch a "falling knife" with gold Thursda...
2
sc.png
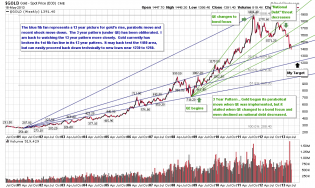
Gold update .. the convergence of the 3 yr and 13 yr fib fan lines was broken today by closing price .. gold buyer...
2
sc.png
Bubbles
6
sc.png
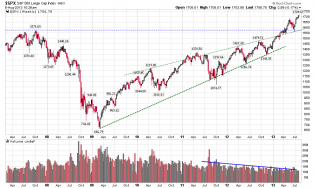
Is the bond bubble next? .. With Fed's multiple intervention probably not .. but it is possible .. in the interim,...