User: facesincabs

Personal Stacks


All Pages Stacked
sc.png

1
TF.png
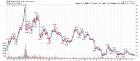
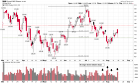
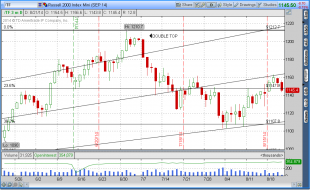
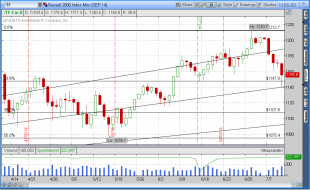
TF back below critical 1148 level early this morning .. watching that pivot at the close today .. chart is still w...
1
sc.png
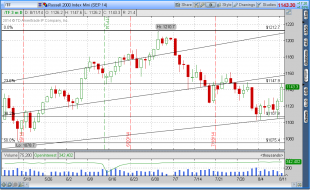
this is primarily why I am NOT afraid of continuing to test small cap shorts (even in the face of a new closing hi...
1
TF.png
Another (better) picture of my short small cap entry earlier this morning .. right at the top at the fib line .. r...
1
sc.png
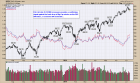
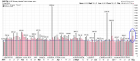
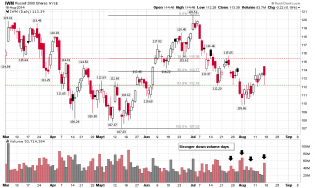
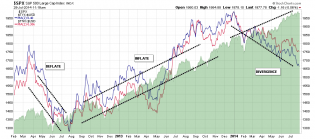
Thursday and Friday selling came with much higher market volume .. that's distribution folks! Institutions were s...
4
sc.png
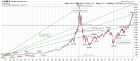
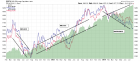
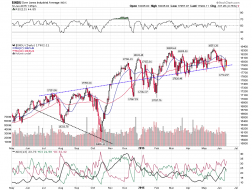
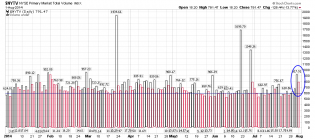
This key inter-market relationship is currently "out of whack" .. it is worth keeping an eye on ..
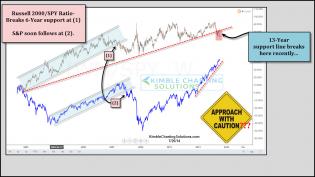
russellspyratiobreaks13yearsupprtjuly26.jpg
Another great chart from Chris Kimble (@kimblecharting) ..
4
sc.png
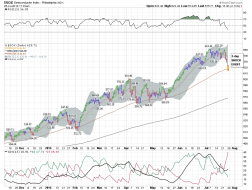
here is a picture of the SOX "shock event" over the past 3 days .. I mentioned it yesterday and this morning .. an...
sc.png
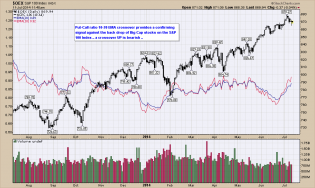
After many months of POMO-induced partying, un-expectant and drunken bulls may be in for some surprises during nex...
2014-07-10-TOS_CHARTS.png
I have been trading small cap's a lot .. so I thought I would share what I see going on today .. notice where the...
2
sc.png
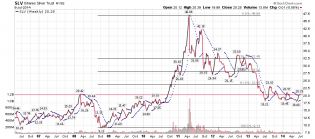
if Gold is going to break out here (miners were up) .. Silver probably needs to get above 20 area .. http://tinyur...

sc.png
Silver Chart (my only one, because I no longer trade Silver) .. technically it does not look good for Silver yet ....
1
sc.png
Shiny Stuff .. a daily chart .. next target is 1161 ..
3
sc.png
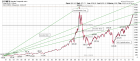
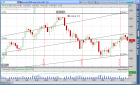
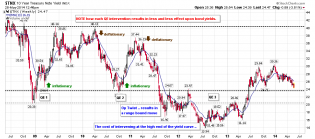
Dropping bond yields have my attention here ..
10 year yield .. closing in quickly on a re-test of the CRITICAL...
3
sc.png
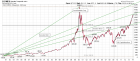
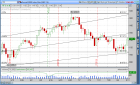
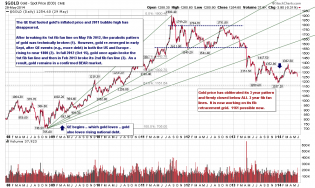
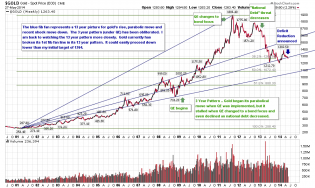
Gold Chart update .. it finally broke an important fib fan line and price inflection point on news the trade defic...
7