Users: facesincabs: All Pages
sc.png

1
TF.png
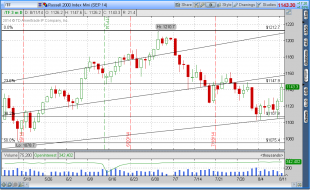
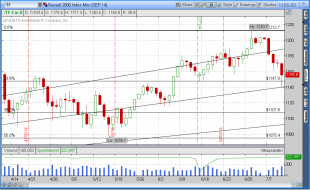
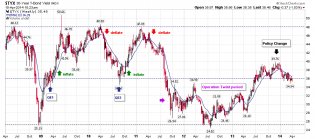
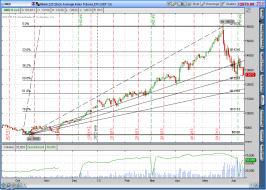
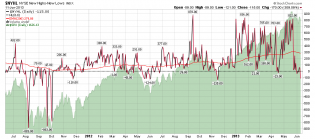
TF back below critical 1148 level early this morning .. watching that pivot at the close today .. chart is still w...
1
sc.png
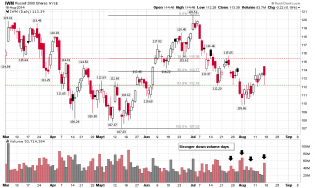
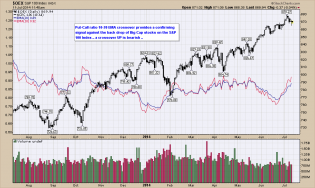
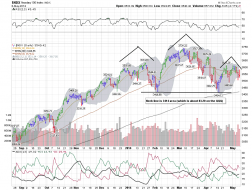
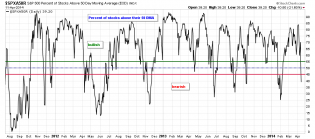
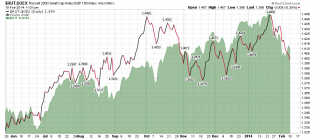
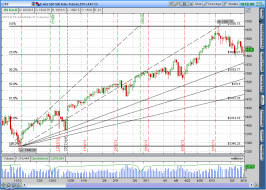
this is primarily why I am NOT afraid of continuing to test small cap shorts (even in the face of a new closing hi...
1
TF.png
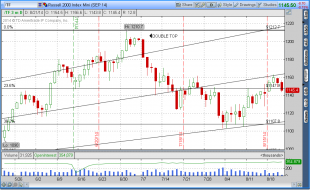
Another (better) picture of my short small cap entry earlier this morning .. right at the top at the fib line .. r...
1
sc.png
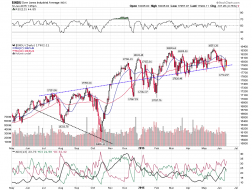
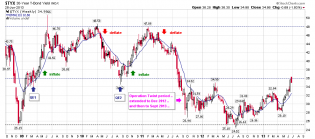
Thursday and Friday selling came with much higher market volume .. that's distribution folks! Institutions were s...
4
sc.png
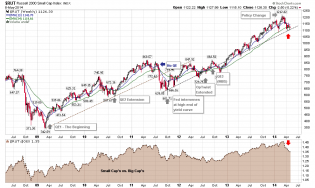
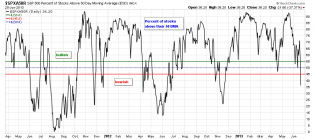
This key inter-market relationship is currently "out of whack" .. it is worth keeping an eye on ..
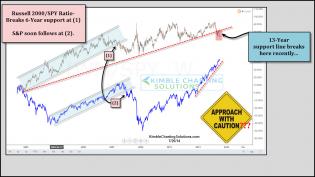
russellspyratiobreaks13yearsupprtjuly26.jpg
Another great chart from Chris Kimble (@kimblecharting) ..
4
sc.png
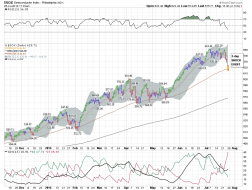
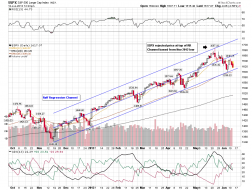
here is a picture of the SOX "shock event" over the past 3 days .. I mentioned it yesterday and this morning .. an...
sc.png
After many months of POMO-induced partying, un-expectant and drunken bulls may be in for some surprises during nex...
2014-07-10-TOS_CHARTS.png
I have been trading small cap's a lot .. so I thought I would share what I see going on today .. notice where the...
2
sc.png
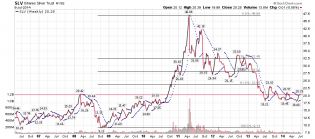
if Gold is going to break out here (miners were up) .. Silver probably needs to get above 20 area .. http://tinyur...
sc.png
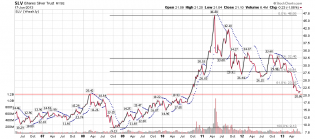
Silver Chart (my only one, because I no longer trade Silver) .. technically it does not look good for Silver yet ....
1
sc.png
Shiny Stuff .. a daily chart .. next target is 1161 ..
3
sc.png
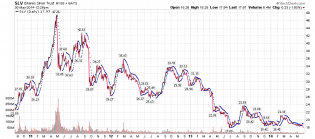
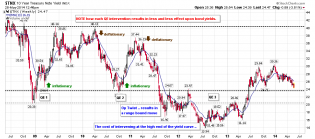
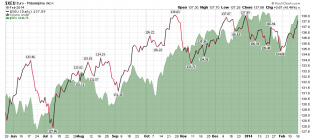
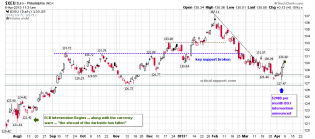
Dropping bond yields have my attention here ..
10 year yield .. closing in quickly on a re-test of the CRITICAL...
3
sc.png
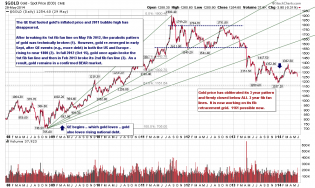
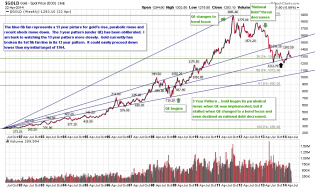
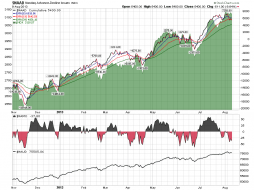
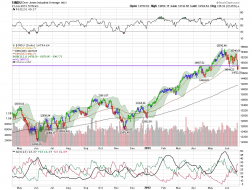
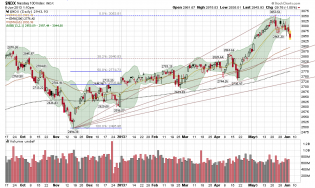
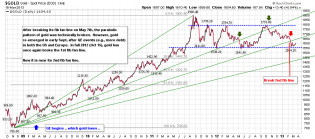
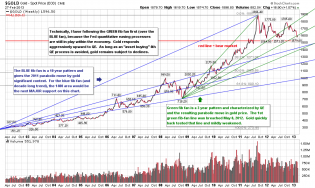
Gold Chart update .. it finally broke an important fib fan line and price inflection point on news the trade defic...
7
sc.png
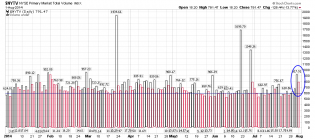
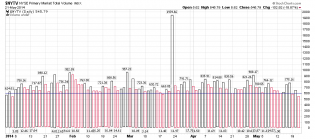
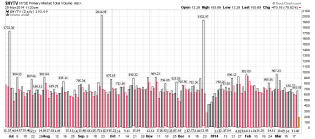
Total NYSE Volume was 2nd lowest of the year (only higher than 1st trading day of the year) .. if BIG bears cannot...
sc.png
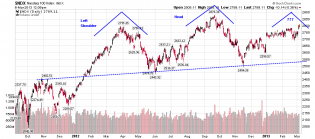
After this week, the $NDX (neck line near 3414) and QQQ (neckline near 83.20) daily charts are forming an H&S patt...
2
sc.png
Small cap's near important inflection point of past support ..
sc.png
Gold has pulled back and is now sitting (again) on an important 13 yr fib fan line .. you may now resume your regu...
sc.png
In looking for the next market weakness or downside catalyst .. the $CYC (cyclicals) busting 1463 support is near...
sc.png
The damage on the charts is beginning to add up for the S&P 500 .. # of stocks below their 50 DMA ..
2
sc.png
Hey kids! .. there is the little thing called deflation (that everyone appears to be ignoring because they are wil...
2
sc.png
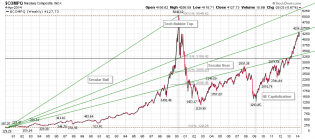
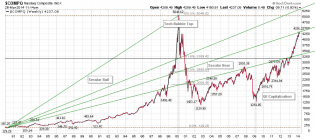
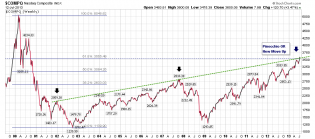
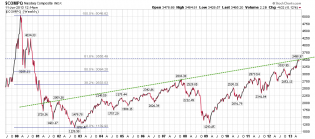
I posted this chart several weeks ago .. so here is an $NDX Chart Update .. 30 years of resistance IS BEING consisten...
sc.png
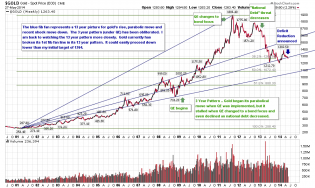
Tech fib resistance holding so far .. a 30 year pattern .. we'll see what happens with the EOQ by Tuesday .. I hav...
sc.png
btw, here is a closer look (daily) at those normal OpEx volume spikes ..
sc.png
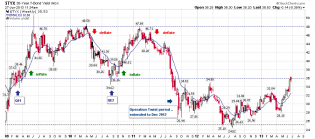
OpEx Thursday is (so far) missing its BIG VOLUME .. could this time actually be different ?? (who really knows) .....
1
sc.png
30 yr yield back near CRITI...
1
sc.png
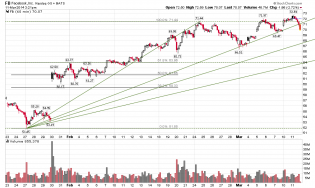
FB finally broke the fib fan line I have been watching .. I am short ..
2
sc.png
UPDATE .. Watching NASDAQ weekly closing price today .. despite the uber-rally (and extreme pop in bond yields thi...
1
sc.png
Inter-Market ..
Commodity rally continues to keep a strong ceiling on bonds .. until maybe Turkey, Argentina o...
sc.png
30 year yield .. approachin...

sc.png
UPDATE on NASDAQ 30 year chart .. we tapped the green fib line today .. I am NOT calling a top with this BUT I sti...
2

sc.png
BIG PICTURE .. two decades of the NASDAQ .. getting closer to bubble resistance (weekend warrior chart) ..
1
sc.png
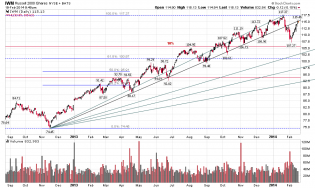
Small cap's have been "on a tear" in the recent retracement up .. however maybe a turn back down (or at least some...
sc.png
When the Euro comes back down .. that's when US equities will probably pull back ..
2
sc.png
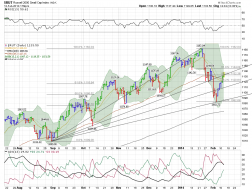
Short-term inflection point for Small Cap's ??
sc.png
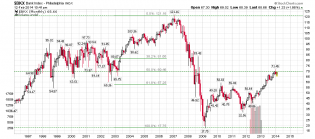
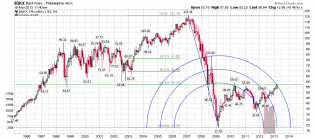
Banking Index (BIG picture) ..
sc.png
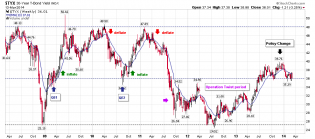
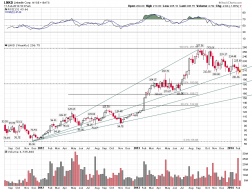
LNKD fading towards its critical ledge near $200 .. the clear and clean breach of the weekly fib fan line is why I...
sc.png
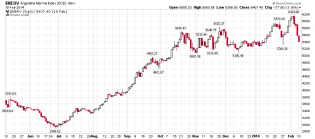
Argentina clearly not out of trouble yet .. recent spike taken out in just 4 days .. and it is now close to a new...
2
sc.png
Small cap's are "relatively" the weakest sector here .. tech (with leadership from AAPL and TSLA) is the strongest.
20140209_long2.png (1238×884)

2
sc.png
Tech extended the rally .. and it is not flinching .. light volume grind up may continue .. AAPL leading this .. a...
sc.png
Hey .. look where we are this morning ..
3
sc.png
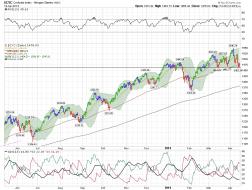
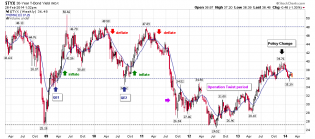
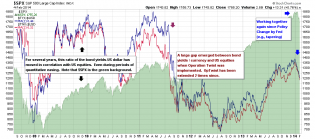
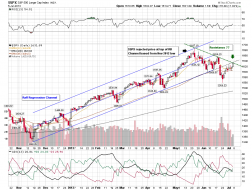
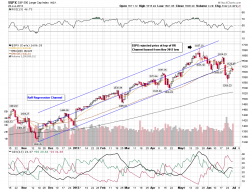
Why I am watching the bond yields more closely after the Fed announced "tapering" .. note changes in the relationship...
sc.png
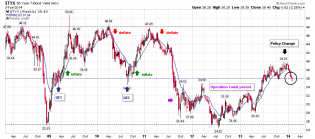
I think that bond yields are a "tell" here. The 30 year yield finally broke support (3.6) and a key pivoting leve...
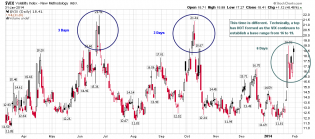
VIX Basing.png
The Volatility indices have been basing now for 5 to 6 days. Past tops on volatility have lasted no longer than t...
6
Kimble.jpg
from Chris Kimble about 30 minutes ago .. worth considering ..
sc.png
We will close the week below the black line .. first time in months .. longer term charts are starting to see some...
sc.png
Value side of the BIG market (DJIA) sitting at and testing prior low .. but today the focus may remain on the tech...
NYTV.png
1
sc.png
Overall .. I think that tech is ready to pull back (not just the Semi's) .. NASDAQ A/D line is back below its 19 E...
sc.png
SOX finally broke this multi-month, wedge-like pattern .. it is showing relative weakness in a very strong (and pe...
sc.png
While indices look bubbly here, I do NOT expect a decent pull back until we see some BIG volume show up .. MM's ca...
1
sc.png
Time for the NIKKEI to shift back down .. futures (/NKD) down 370 currently .. so watching this chart and relationship.
sc.png
Tech is making a very aggressive price run on light summer volume here and crossing through 13 year resistance las...
sc.png
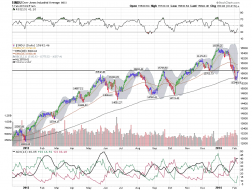
Tech observation and update .. big picture from the bubble pop .. 3 tops have been marked (so far) by the rising u...
5
sc.png
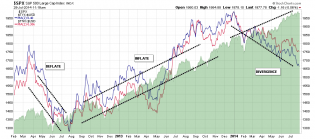
We appear to be at a decision point for equities .. midterm bears could easily get knocked out here .. as tweeted...
2
sc.png
The $SPX ended up seeing "selling" on Friday .. what initially looked like an up day turned into "churn and exit"...
2
sc.png
30 year yield weekly .. hit...
1
GC.png
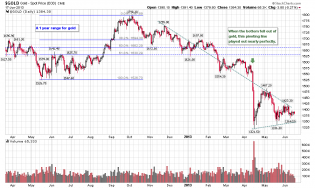
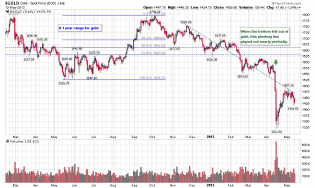
Gold .. here is that 1209 fib line from the 15 year (trend) chart using /GC ..
sc.png
Here is why I think bond yields may hit some resistance now .. and why inflating equities (as an indirect NY Fed s...
gold.png
gold perfectly back tested its broken fib line this morning .. 1302 looking like a key level and current resistance ..
sc.png
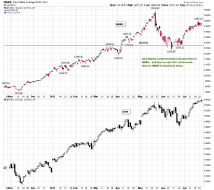
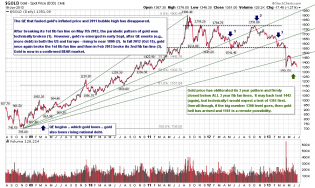
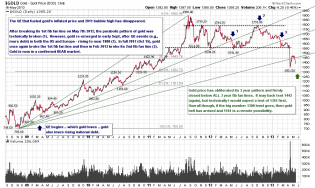
after an 8 month, unending trend up .. bears finally have a technical advantage with the major support break .. th...
sc.png
for the short-term and mid-term .. we are back to bearish .. with the majority of $SPX charts below their 50 DMA ..
sc.png
Gold (/GC) has confirmed its 2nd leg down overnight on its 4 year, daily chart .. it is currently hovering this mo...
1
sc.png
addendum to comment above .. here is a daily gold I am watching .. note the wedge pattern setting up a possible 2n...
sc.png
I think that PM's still have a chance to move down in a 2nd "major" leg (not predicting that, but worth watching)...
2
NKD.png
for those interested .. here is why I think that the $NIKK levels are important going into the weekend .. it is pr...
2
ES.png
The /ES tapped a key fib line in its pull back for the 2nd time last night .. 1604 is also very close to the 7 mon...
sc.png
S&P 500 could get to 1609 or so .. if it continues to follow its 7 month channel .. with nearly $4B in POMO on Thu...
sc.png
$NYHL .. one of the charts I shared this evening .. when this one gets below "zero", the equity markets can turn v...
2
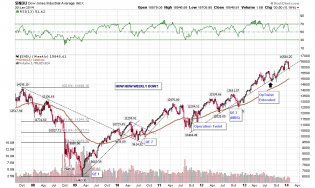
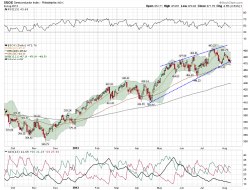
NASDAQ.png
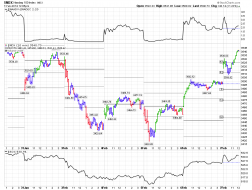
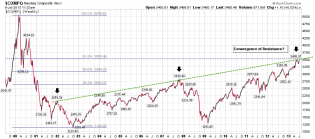
NASDAQ closing in on major test and resistance .. it has taken 3 or 4 versions of QE and other accommodations to g...
5
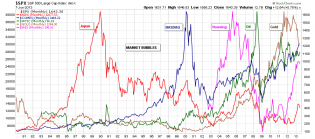
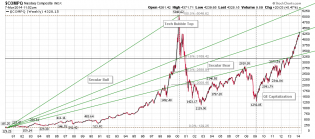
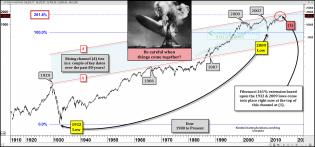
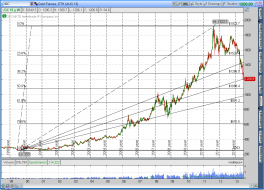
bubble.png
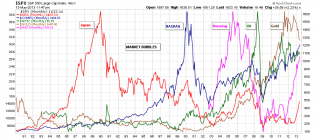
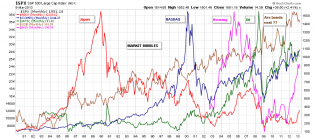
Just to provide some context to my last chart .. here is map of bubbles (and their bear markets) over the last 30...
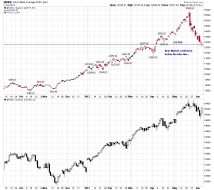
japan.png
Japan technically confirmed its entry into a bear market this week by declining over 20% from its recent high .. t...
1
sc.png
NASDAQ 100 tapping on its BIG early-May gap today .. also watching possible island top ..
One reason I think...
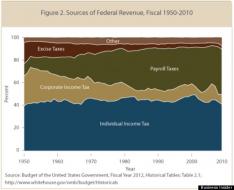
Federal Revenue Sources.jpg
Federal Revenue Sources .. why the argument towards Apple and Tim Cook this week has merit ..
sc.png
Gold Short Term .. I am looking for a test of 1351 area .. many tried to catch a "falling knife" with gold Thursda...
2
sc.png
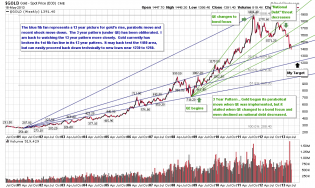
Gold update .. the convergence of the 3 yr and 13 yr fib fan lines was broken today by closing price .. gold buyer...
2
sc.png
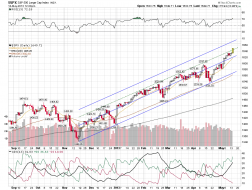
Today provides the 1st price sign that the markets may be starting a parabolic move .. index price is starting to...
sc.png
Gold - why I am shorter than the curb in front of our house ..
3
sc.png
Bubbles
6
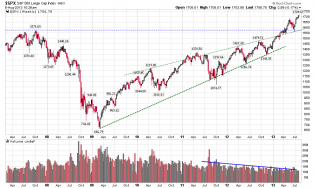
sc.png
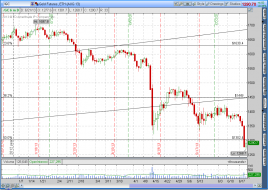
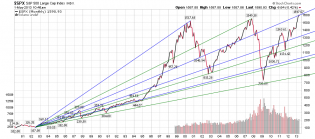
30 years of $SPX fib fans ....
sc.png
The BOJ intervention's impact upon the Euro is obvious .. probably going to lengthen the current topping processes...
sc.png
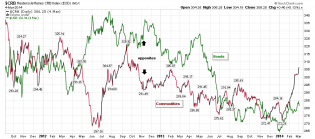
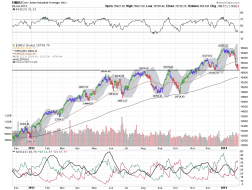
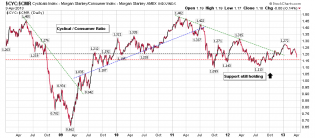
Cyclical-Consumer Ratio turning down .. a test of support (red dashed line) is close by .. a break of this support...
sc.png
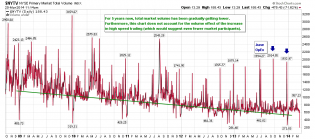
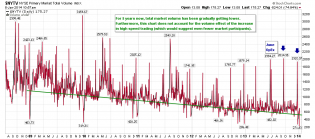
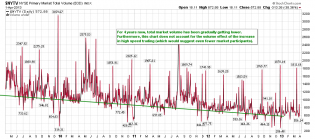
Total market volume continues its 4 year decline and remains near all time lows .. last Thursday (day before Good...
1
sc.png
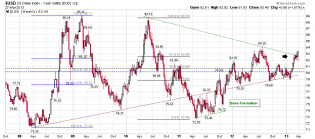
US Dollar break out from pattern is now much more clear.
sc.png
The "fear trade" emerged quickly on Cyprus news and gold reflected that .. I am not trading gold yet .. but watchi...
sc.png
When whole countries (like little ol' Cyprus) enter a crisis .. watch the banks for "tells" about the markets .. a...
sc.png
Is the bond bubble next? .. With Fed's multiple intervention probably not .. but it is possible .. in the interim,...

cartoon-bear-7.gif
Due to sequestration and related budget cuts, the light at the end of the tunnel has been turned off for bears.
sc.png
Nearly 2 years and still developing H&S pattern on the NASDAQ 100 starting to look a bit wonky after the recent ga...
gold big picture.png
2