User: facesincabs: Resistance
TF.png
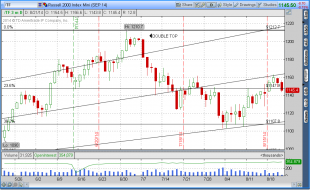
TF back below critical 1148 level early this morning .. watching that pivot at the close today .. chart is still w...

1
TF.png
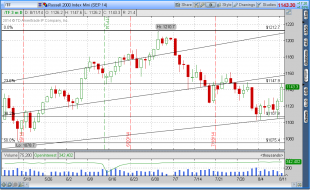
Another (better) picture of my short small cap entry earlier this morning .. right at the top at the fib line .. r...
1
sc.png
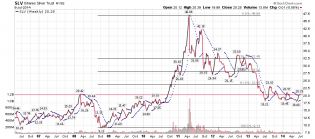
if Gold is going to break out here (miners were up) .. Silver probably needs to get above 20 area .. http://tinyur...
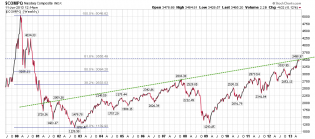
sc.png
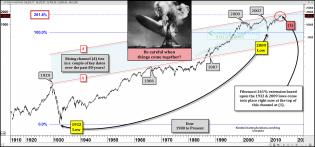
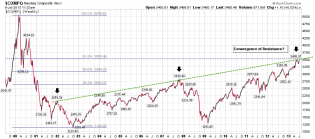
I posted this chart several weeks ago .. so here is an $NDX Chart Update .. 30 years of resistance IS BEING consisten...
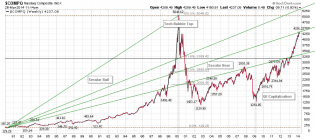
sc.png
Tech fib resistance holding so far .. a 30 year pattern .. we'll see what happens with the EOQ by Tuesday .. I hav...
sc.png
UPDATE .. Watching NASDAQ weekly closing price today .. despite the uber-rally (and extreme pop in bond yields thi...
1

sc.png
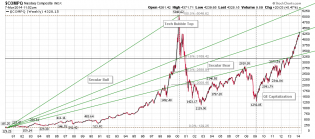
UPDATE on NASDAQ 30 year chart .. we tapped the green fib line today .. I am NOT calling a top with this BUT I sti...
2

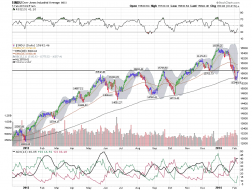
sc.png
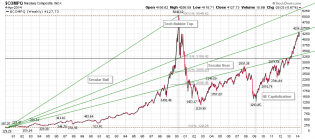
BIG PICTURE .. two decades of the NASDAQ .. getting closer to bubble resistance (weekend warrior chart) ..
1
sc.png
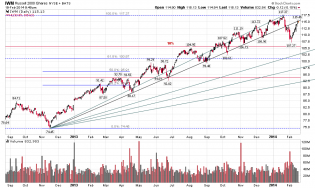
Small cap's have been "on a tear" in the recent retracement up .. however maybe a turn back down (or at least some...
sc.png
Short-term inflection point for Small Cap's ??
sc.png
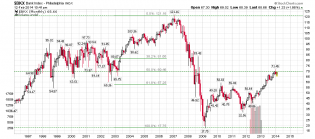
Banking Index (BIG picture) ..
sc.png
Hey .. look where we are this morning ..
3
Kimble.jpg
from Chris Kimble about 30 minutes ago .. worth considering ..
sc.png
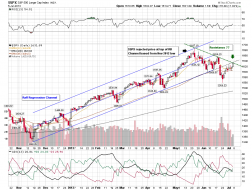
Tech is making a very aggressive price run on light summer volume here and crossing through 13 year resistance las...
sc.png
5
sc.png
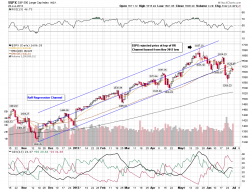
We appear to be at a decision point for equities .. midterm bears could easily get knocked out here .. as tweeted...
2
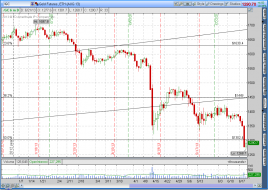
sc.png
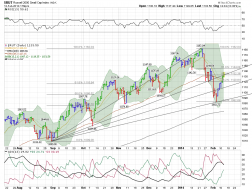
The $SPX ended up seeing "selling" on Friday .. what initially looked like an up day turned into "churn and exit"...
2
sc.png
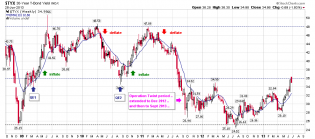
30 year yield weekly .. hit...
1
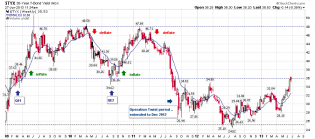
sc.png
Here is why I think bond yields may hit some resistance now .. and why inflating equities (as an indirect NY Fed s...
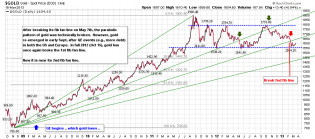
gold.png
gold perfectly back tested its broken fib line this morning .. 1302 looking like a key level and current resistance ..
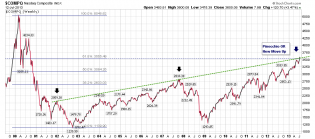
NASDAQ.png
NASDAQ closing in on major test and resistance .. it has taken 3 or 4 versions of QE and other accommodations to g...
5
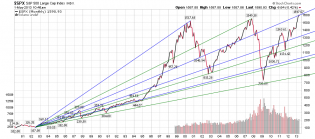
sc.png
30 years of $SPX fib fans ....
sc.png
The "fear trade" emerged quickly on Cyprus news and gold reflected that .. I am not trading gold yet .. but watchi...
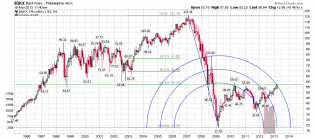
sc.png
When whole countries (like little ol' Cyprus) enter a crisis .. watch the banks for "tells" about the markets .. a...