User: facesincabs: Resistance: NASDAQ.png

NASDAQ.png

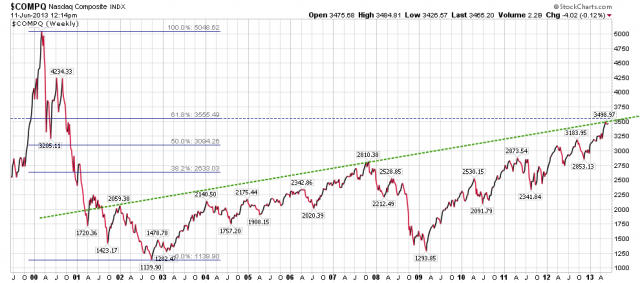
NASDAQ closing in on major test and resistance .. it has taken 3 or 4 versions of QE and other accommodations to get here ..

Comments

RosabarbaRosabarba
Bit of a no-no to anchor the TL to a point prior the low. 6/11/13
facesincabsfacesincabs
Not concerned .. I am highlighting the 3 prior resistance points .. additionally I am seeing other chartists and technically oriented folks (like Chris Kimble) draw the same line as something to watch .. 6/11/13
RosabarbaRosabarba
The fib line you have is relevant and bears watching.  
 
The first resistance point is pre-trend, so it doesn't make sense as a *trend*line. The third point hasn't pulled back enough to define it as a resistance point (not *yet*, anyway ... Tim also tends to jump the touchpoint-gun in this way, so you're in good company ;) ). That only leaves the second point as significant to the current trend, imo. 6/11/13
facesincabsfacesincabs
I did not draw a trend line (and never mentioned trend) .. my only comment and observation has been about "possible resistance" and its convergence with the broader fib retracement .. 6/11/13
RosabarbaRosabarba
That little dashed-line green thingy that connects various price points ... that's a trendline ("possible resistance line"?).  
 
Or are you saying you didn't draw it? In any event, whether it was you or Kimble or whomever, it incorporates a technical mistake. These things happen. It's not the end of the world, but it's also not technically valid in the way the fib line is, imo. 6/11/13
...