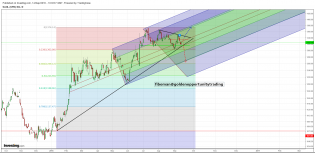
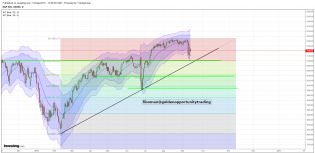
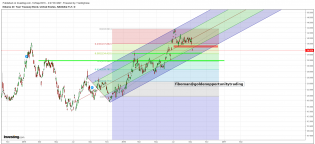
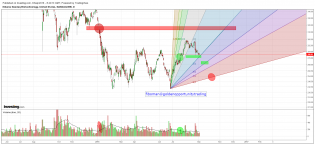
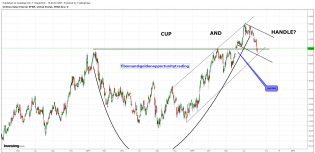
User: fiboman: Golden Opportunity Trading
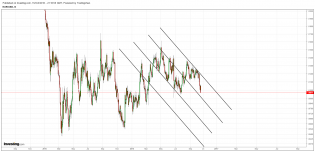
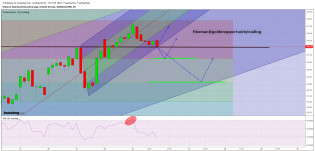
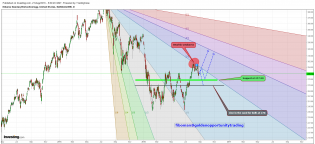
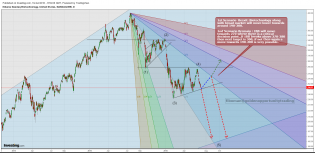
usdx 04.03.17.png
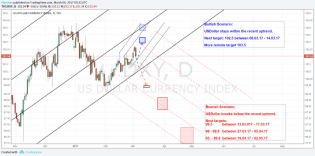
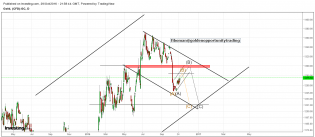
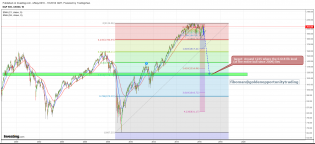
us dollar index ahead of FED

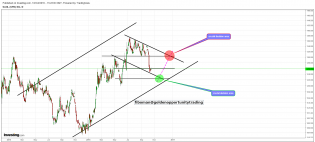
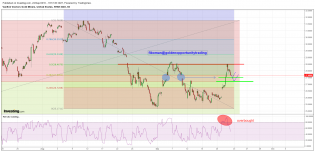
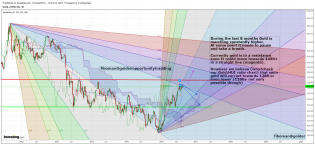
gold1 06.01.17.png
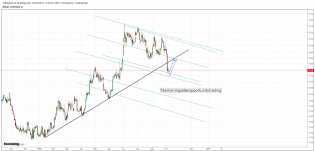
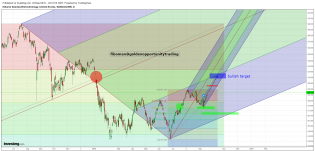
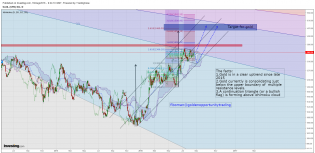
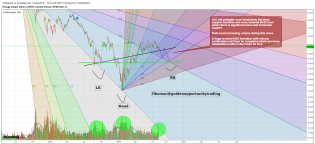
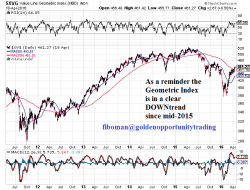
EWI 18.12.16.png
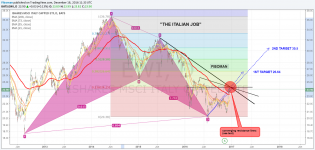
The Italian Job
1
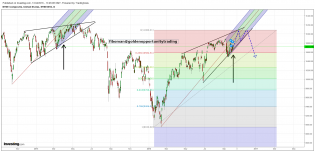
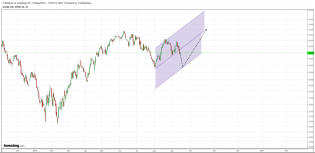
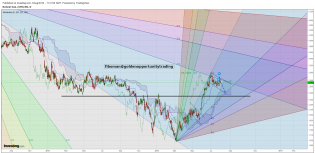
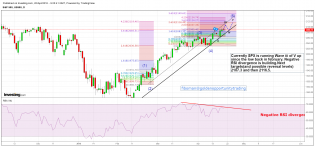
spx1 14.12.16.png
1
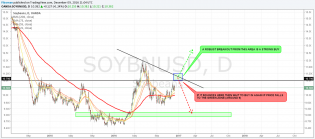
SOY 09.12.16.png
SOYBEANS
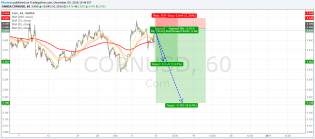
CORN 09.12.16.png
CORN
5
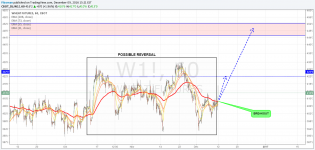
WHEAT 09.12.16.png
WHEAT: BULLISH BREAKOUT AFTER REVERSAL FORMATION
vnq 09.12.16.png
REIT ETF
2
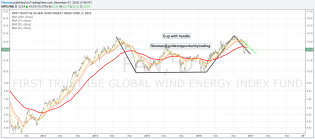
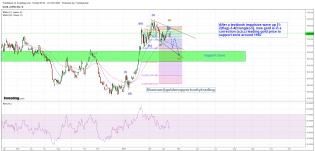
fan 07.12.16.png
1
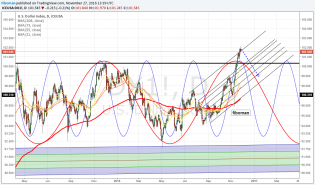
usdx 27.11.16.png
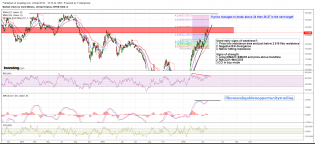
USD is overextended
2
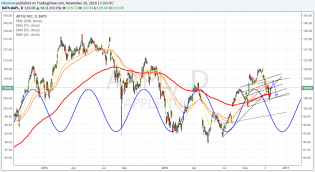
aapl(1) 20.11.16.png
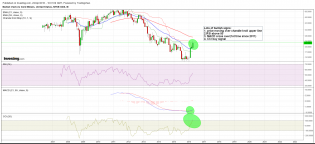
due for a low (either 106.5 or 100)
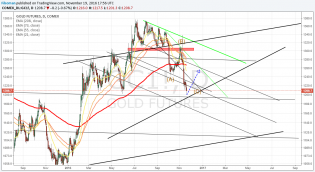
gc 19.11.16.png
about to bounce
1
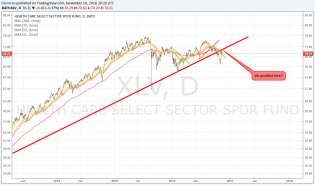
xlv 16.11.16.png
1
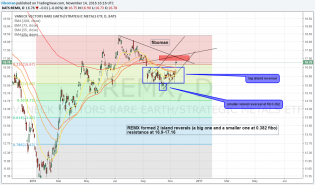
remx 14.11.16.png
2
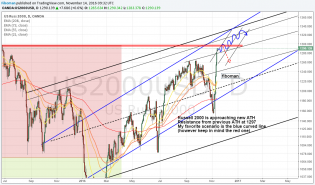
us2000 14.11.16.png
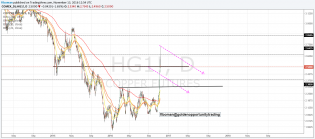
hg1 13.11.16.png
Is copper out of the woods?
1
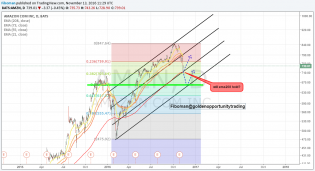
amzn 13.11.16.png
AMZN: At EMA208....
2
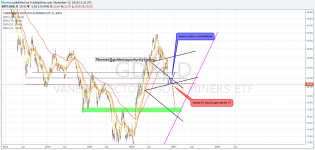
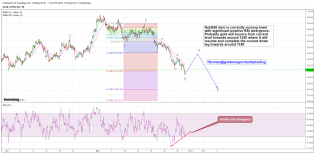
gdx 13.11.16.png
GDX
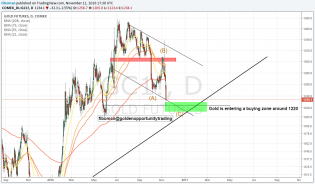
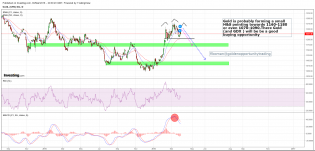
gc 11.11.16.png
Gold near a buying zone
1
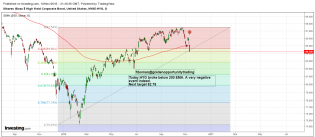
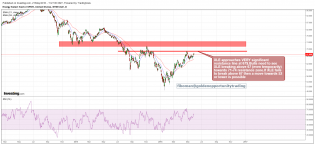
hyg 10.11.16.png
hyg below ema200
gc1 29.10.16.png
tvc_714f866586aa2a142fd2aac161dbc49e.png
junk bonds correction?
gdx 23.10.16 (2).png
gdx
dxy 19.10.16.png
dxy 15min
spx 19.10.16.png
spx
gdx1 18.10.16.png
3
original_64820921-.jpg
dxy 16.10.16.png
DXY
eurusd 15.10.16.png
eurusd channels
gc 13.1016.png
Gold within 2 channels and some crucial decision price-time points...
1
silver 06.10.16.png
silver ready to bounce?
nya 01.10.16.png
eerie similarities...
1
IBB 24.09.16.png
gdx 22.09.16.png
Gold miners:out of the woods? Not quite yet
1
IBB 20.09.16.png
cl 15.09.16.png
oil first 39-40 then up into a channel
gold (p) 14.09.16.png
Gold:decision pending...
1
spx 13.09.16.png
SPX: Is the current upmove dead?
1
TLT(p) 10.9.16.png
IBB 03.09.16 (p).png
Biotech
IBB 27.08.16.png
Biotech
1
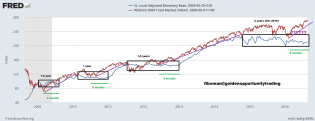
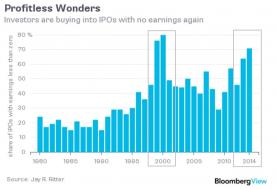
fredgraph (2).png
US Equity Market: A FED run business
1
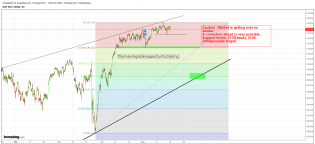
spx 19.08.16.png
stall speed...
3
gold 18.08.16.png
Towards 1450-1500
1
xlu 17.08.16.png
XLU cup & handle
5
xlp 16.08.16.png
2
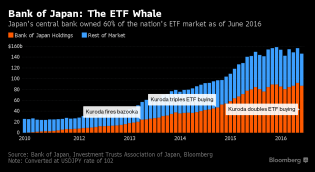
japan etf.png
free markets....
2
xlp 14.08.16.png
long XLP
1
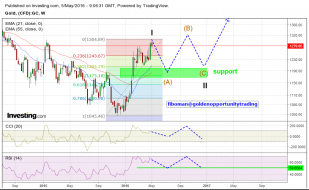
gold weekly (1) 10-08-16.png
2
XLE 04.08.16.png
XLE Huge Inverted H&S
4
ng 03.08.16.png
2
2.png
1
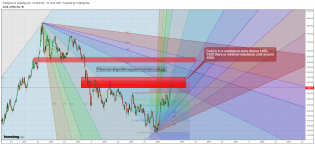
gold 13.07.16 (2).png
Gold in a resistance zone without any signs of weakness
1
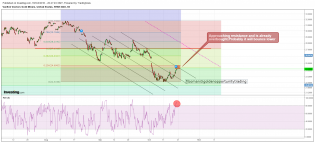
remx 10.07.16.png
A "rare" buying opportunity after 5 years of a relentless bear market?
2
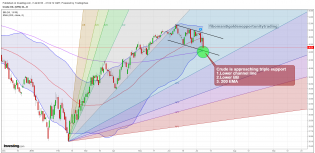
crude 7.07.16.png
Crude is approaching, while moving in a downward channel(? bull flag- wave 4), triple support at around 44-44.5....
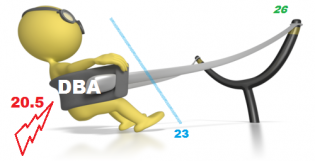
launching_from_sling_shot.png
Agriculture ready for launch?
2
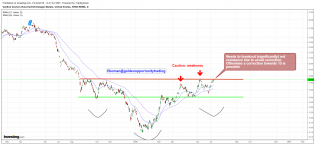
HYG 27.06.16.png
Today we saw a nasty break down for High yield Bonds(HYG) signaling further weakness initially towards 78.5-80.Eq...
1
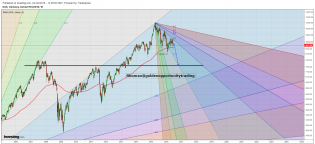
SPX summer 2016.png
BREXIT, Yellen and the morning after pill
1
DAX (1) 23.06.16.png
BREXIT: the SHTF moment for DAX?Not quite yet...
3
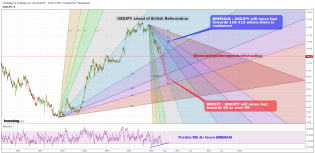
USDJPY (1) 22.06.16.png
USDJPY ahead of British Referendum
2
IBB 19.06.16.png
Biotechhnology (IBB) : Brexit or not there is still potential for a further move lower
1
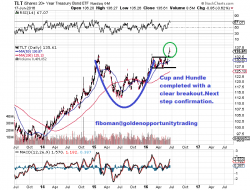
TLT 18.06.16.png
TLT CUP AND HANDLE
2
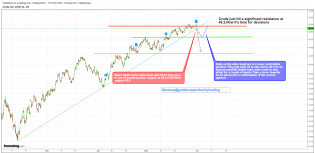
spx 14.06.16.png
my preferred road map
1
eurusd(2) 06.2016.png
October may signal a trend change for Euro
4
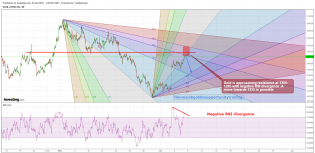
gold (60 min) 08.06.16.png
gold is approaching resistance at 1255-1265 with negative RSI divergence .A move initially towards 1235 is very p...
2
oil 31.05.16.png
update on crude
1
gold (60min) 29.05.16.png
Gold: A quick update
1
xle (1) 27.05.16.png
XLE make it or break it or the 67$ level
1
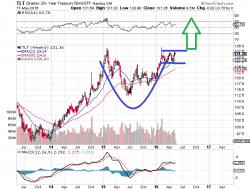
tlt 18-05-16.png
TLT cup with handle
3
NXPI bye bye.png
NXPI Bye Bye!
3
spx 11.05.16 (2).png
SPX: H&S???
PCPs_May2016.gif
2
14624908581491312912890.png
2
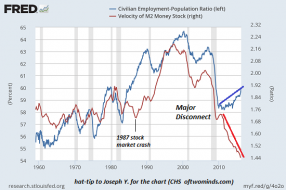
MV-employment-ratio5-16a.png
1
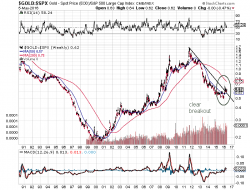
gold.spx 06.05.16.png
Another proof of the current gold's bull market
1
gold 05.05.16.png
1
spx (w) 04.05.16.png
2
spx (d) 04.05.16.png
1
GDX (D) 23.04.16.png
2
GDX (M) 23.04.16.png
5
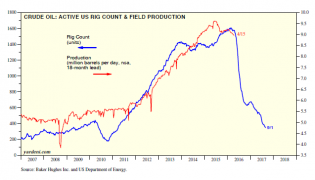
fig1.png
2
xvg 20.04.16.png
4
spx 20.04.16.png
1
gold 16.04.16.png
Gold ongoing correction
1
8347216_orig.png
An interesting analog..
spx 13.04.16 (2).png
1
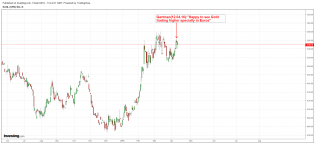
gc gartman.png
Yesterday Gold had its Gartman time

VIX(60) 13.04.16.png
3

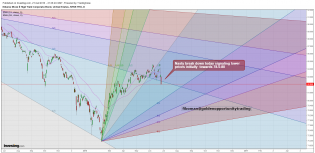
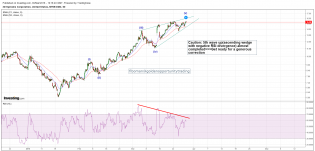
vix 07.04.16.png
complacency is building fast-->we expect a significant upside move for VIX i.e a plunge in share prices
2
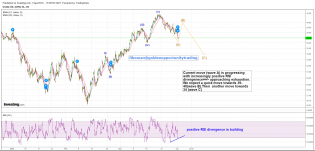
spx60 06.04.16.png
3
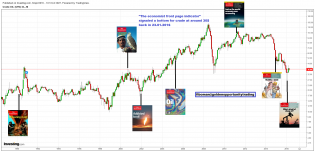
economist front page.png
The economist front page indicator:Crude has bottomed out
1
NYSE-investor-credit-SPX-since-1980.gif
1
NYSE-margin-debt-SPX-since-1995.gif
NYSE margin debt
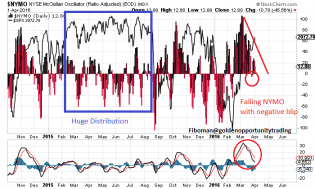
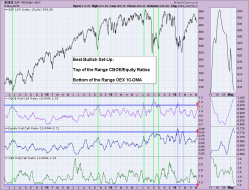
NYMO 02.04.16.png
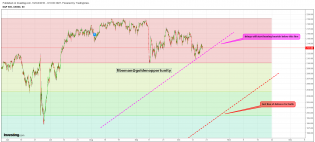
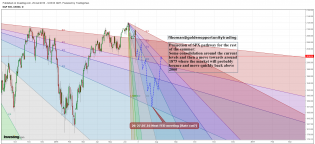
Current rally is running on fumes and a concrete wall is approaching fast!
1
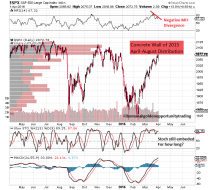
spx 02.04.16.png
Current rally is running on fumes and a concrete wall is approaching fast!
4
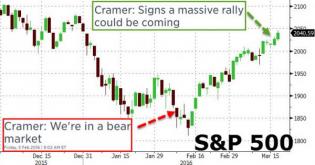
20160318_cramer_1_0.jpg
3
crude 01.04.16.png
DDD 30.03.16.png
3D printers ready for correction... a buying opportunity
1
gc 30.03.16.png
2
crude 23.03.16 (60min).png
crude approaching a turning point
1