User: rabbi_geoff: Personal Equity Outlook
Treasury Yield Snapshot

Conference Board's Index of Leading Economic Indicators
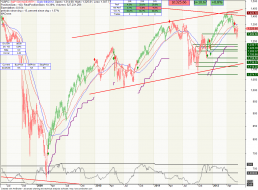
7-6-12-Daily-SP-w-above-200-day-MA.gif (750×611)
http://3.bp.blogspot.com/-pnXcFsLJt0k/T_mdtlRpryI/AAAAAAAAC2s/JBbBW...

3
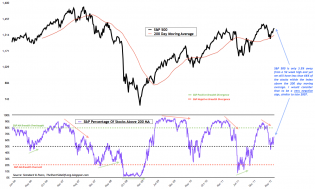
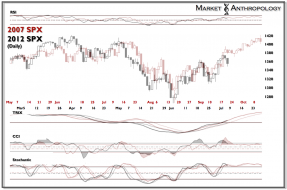
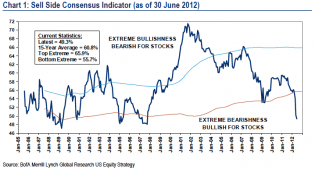
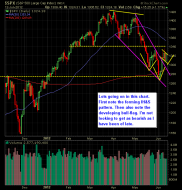
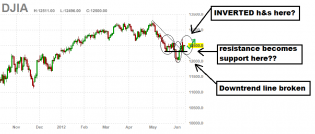
Short Side Of Long: Is The Equity Market Topping?
It looks like stocks could take out their highs for the year in one final "F you" to the bears and make a top.

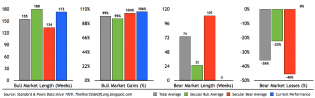
Short Side Of Long: Is The Equity Market Topping?
Credit to Shortsideoflong for this bar graph.
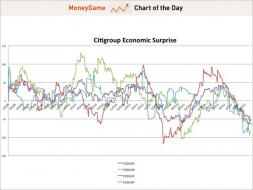
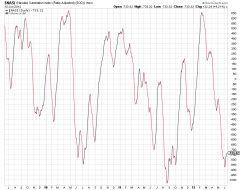
Citi Economic Surprise Index
chart
Screen Shot 2012-07-02 at 6.58.39 PM

2
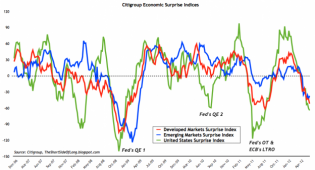
cesi
This compares actual economic data to the analyst’s expectations. So when the analysts finally reverse course a...
http://www.thetechnicaltake.com/wp-content/uploads/2012/06/fig-1...
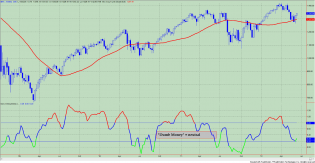
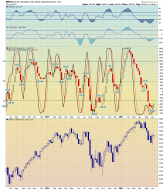
From Zerohedge...it's a composite of a lot of sentiment indicators that tend to be wrong on the markets. Things lo...
2012-06-16_0528 - dhdware's library

06102012 near.png

1
92d7014f7b9e84c35750fed5.png (600×625)

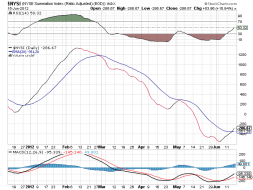
$NYSI
$NASI
http://i657.photobucket.com/albums/uu293/bigelkhorn/vrew.png

Home » Most Recent Stories
11 June 2012 by Cullen Roche
8 CommentsJP Morgan has some good comments on the markets and the effect of potential future government actions. ? For now, they’re saying the markets will likely have troubl...
JP MORGAN: QE3 IS NOT A BULLISH CATALYST | PRAGMATIC CAPITALISM
FF
6
http://www.raymondjames.com/images/inv_strat/120529_1lg.gif
1
Chart In Focus
Looking for choppy to bullish action
1