User: rabbi_geoff
Member Since: 6/9/12
Instruments

rabbi_geoff's Profile
Personal Stacks

All Pages Stacked

Treasury Yield Snapshot

Conference Board's Index of Leading Economic Indicators
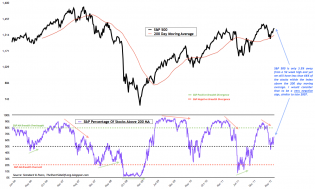
7-6-12-Daily-SP-w-above-200-day-MA.gif (750×611)
http://3.bp.blogspot.com/-pnXcFsLJt0k/T_mdtlRpryI/AAAAAAAAC2s/JBbBW...

3
http://www.raymondjames.com/images/inv_strat/120709_2lg.gif

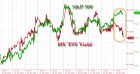
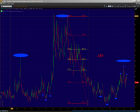
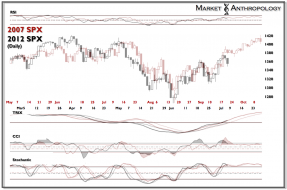
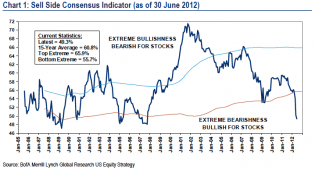
Short Side Of Long: Is The Equity Market Topping?
It looks like stocks could take out their highs for the year in one final "F you" to the bears and make a top.
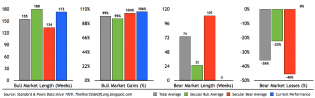
Short Side Of Long: Is The Equity Market Topping?
Credit to Shortsideoflong for this bar graph.
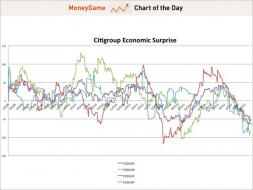
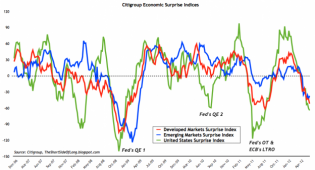
Citi Economic Surprise Index
chart
Screen Shot 2012-07-02 at 6.58.39 PM

2
cesi
This compares actual economic data to the analyst’s expectations. So when the analysts finally reverse course a...
http://www.raymondjames.com/images/inv_strat/120618_2lg.gif
This chart was as of Monday. I'd expect about a month of choppy action to work our way back to neutral on the McCl...
http://www.ritholtz.com/blog/wp-content/uploads/2012/06/aaaaaaaaaaa...
The definition of 'Household sector' is:
or most categories of financial assets and liabilities, the values for...
