Browse Stacks: Government: Federal
170a5b9d44b41d4a402d5962a7bb9a33.png (1005×550)

2
77821c9279de91d95b68f2888979f3b0.png (673×416)
US budget deficit oct nov.jpg (1102×730)
interest expense dec 24.jpg (1280×806)
spending categories.jpg (974×1370)
The surge in spending was driven primarily by higher spending on health, defense and Social Security, but mostly a...
govt spending 6mma.jpg (1077×651)
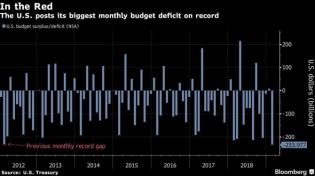
US Budget Deficit Soars In Worst Start To Year On Record
0 (52)_5.jpg (1133×657)
how the composition of US revenues and spending has changed over the past decade.
0 (51)_5.jpg (1280×613)
the projected interest paid on US federal government debt, expressed as a % of GDP.
1
slopechart_FR:RRPONTSYD.jpg
Reverse Repo just about zeroed out
bfm6BB0_0.jpg (736×398)
Sovereign credit risk for US of A
1
July 2024 deficit.jpg (991×600)
US Records 2nd Biggest July Deficit In History As 25% Of Tax Revenue Go To Pay Interest
2
slopechart_FR:WALCL-FR:RRPONTSYD*1000-FR:WTREGEN*1000.jpg
Liquidity testing lower TL

Federal-Deficit-as-Percentage-of.jpg (977×730)
2023-12-07_09-18-56.jpg (1280×921)
Thanks, Mister President!
interest vs military budgetr.jpg (987×548)
CBO debt forecast 2.15.2023_6.jpg (1191×670)
2
annualized interest payments_2.jpg (1050×602)
US is set to spend over $1 trillion in interest on government debt for the first time ever.
1
cumulative deficits_1.jpg (1280×807)
US federal deficit for fiscal 2023 up a staggering $1tn to $1.4tn from year before...
era of fiscal excess_1.jpg (857×500)
Waste, waste, and more waste
1
SilkRoad.png
This is what happened to the price of Bitcoin when the darknet website "Silk Road" was shutdown. Silk Road was rep...

bfmA1C8.jpg (941×565)
Debt-Ceiling drama is fading fast with USA CDS compressing..
TSY cash.png (1280×757)
Ha ha ha ha
2
US govt spe3nding next 10 years_0.jpg (620×484)
1
debt limit deadline_1.jpg (674×436)
FgGG7xCWAAQ1_eM (1576×834)
3
Interest-national-debt-july-2022-chart-3.jpg (1000×750)
According to CBO’s projections, interest payments would total around $66 trillion over the next 30 years and wou...
1
fredgraph.png (700×866)
fredgraph.png (700×718)
Government Transfer Payments, 1980-2020
3
bfmDC26.jpg (1015×568)
GDP-Government-Interventions-062931_1.png (812×445)
1
CUM BUDGET DEFICIT SEPT 2021.jpg (1280×807)
1
fredgraph.png (700×718)
fredgraph.png (900×670)
Government Transfer Payments As % of GDP
fredgraph.png (1168×670)
YoY Change In Government Transfer Payments In Billions, 2000-2021
Screen Shot 2021-04-29 at 10.01.51 AM.png (2022×1092)
America well on the road to ruin
Screen Shot 2021-05-19 at 1.03.08 PM.png (1926×1050)
1
Screen Shot 2021-05-19 at 1.05.32 PM.png (1920×1060)
1
Screen Shot 2021-05-19 at 12.57.37 PM.png (1924×1066)
fredgraph.png (800×820)
1
fredgraph.png (700×718)
Federal expenditures
2
fredgraph.png (968×770)
Government % of the U.S. economy
1
stimulus3-21 (1).png (500×493)
American-Rescue-Plan-Act-of-2021-1.9-Trillion-Covid-Relief-Bill-Exp...
2
fredgraph.png (900×820)
Incredible
3
whats in the stimulus deal.jpg (824×591)
2
fiscal support dec 2020.jpg (1280×807)
US Starts Off Fiscal 2021 With Largest Two-Month Budget Deficit On Record
IB-BR-img9.png (800×446)
Totally fucked.
2
deficit summary oct 2020.jpg (1280×807)
US Starts Off Fiscal 2021 With Largest October Budget Deficit On Record
3
The United States Department of Justice
DOJ - brings many COVID-19 fraud cases

2
budget deficit fiscal 2020.jpg (1280×806)
1
transfer payments % of total_1.jpg (891×591)
fredgraph.png (950×670)
fredgraph.png (950×670)
Government transfers rapidly approaching the same level as wages
3
file

1
transfer payments total.jpg (970×669)
A Quarter Of All Personal Income In The US Now Comes From The Government
4
usa-debt-768x574.png (768×574)
govt spending 5.12.jpg (815×535)
US April Deficit HIts Record $738BN As Government Spends $1 Trillion In One Month
1
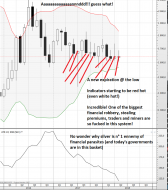
Weekly.jpg
Thought I'd have another look at the weekly chart to see if there was anything new that might make sense. The Blac...
3
slopechart_BA.jpg
I'm joining the Space Force.
Boeing’s expertise spans a broad range of products in defense. Fighter jets, rotorc...

2
what is in the 2 trillion bill.jpg (718×528)
1
3 feb14.PNG

interest expense feb 2020.jpg (722×462)
cumulative deficit feb 2020.jpg (1280×800)
deficit jan 2020.jpg (760×998)
GDP-GDP-Less-Government-Spending-020520.png (960×596)
Debt-Total-GDP-Growth-011220.png (1022×564)
1
deficit since 2011.jpg (1280×801)
A new record of Federal losses. USA! USA! Hey, at least $TSLA is up, right?
5
Chile.jpg
Everything is fine. It's only Chile.
2
cum deficit nov 2019.jpg (1280×801)
Death throes of an empire
ages.png (693×414)
Image_2_20190816_TFTF.png (630×574)
OMB projections.jpg (1105×783)
1
interest payment.jpg (722×462)
Starting In 2024, All US Debt Issuance Will Be Used To Pay Only For Interest On Debt
Federal-Debt-Deficit-Projections-121517.png (1047×674)
Holy Christ
2
slopechart_GLD.jpg
@TK we are undeserving for all you do for the losers.
Follow the Losers $TRX
Another Loss:
https://www.aol...

1
slopechart_GDXJ.jpg
$GDX didn't make it either.
/GC targeting Sub $1400.00 again.
$TRX to Zero Oh My! lol
Does Keith Richard pr...
1
deficit.jpg (670×376)
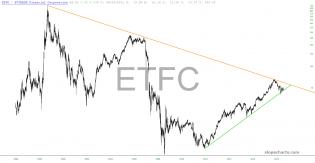
slopechart_ETFC.jpg
@PipeSticks I had a Guinness last night. He was not BLOND and a very TastyTrade ;-)
Thanks @Gerald
Go $...
DyqOIUoXQAEVsqt.jpg:large (1658×790)
1
ixcz5qfiq9521.png (960×720)
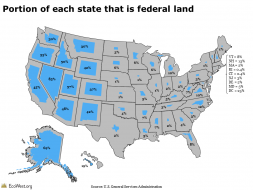
Portion of each state that is federal land
3

A Polar Opposite Sentiment Swing – Notes From the Rabbit Hole
ChaChing: '¯\_(ツ)_/¯'
Thanks @TK @SpaceX -->> 'merica IS GREAT!
Did you miss it LIVE? https://www.youtu...

4
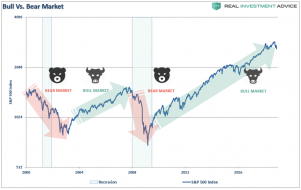
SP500-Bull-Bear-Market-112618-2.png (890×561)
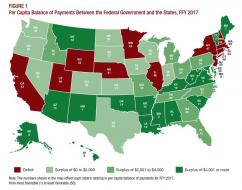
per capita balance of payments.jpg (890×697)
4
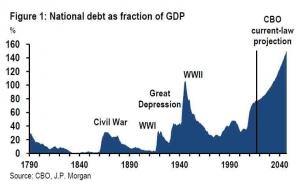
jpm debt cbo forecast_1.jpg (763×481)
We are so screwed
8
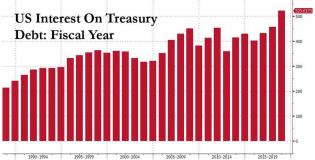
US interest on fiscal debt.jpg (890×453)
As the market's attention gradually turns to rising rates and interest expense, one number that will stick out is...
2
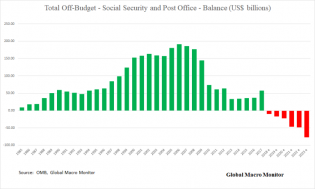
treasury_off_budget.png (768×463)
No more free ride borrowing from the Social Security Trust Funds as the program is now running a structural defici...
1
2018-09-21_9-32-22.jpg (890×463)
Thanks @TimKnight for all you do.
GO Rosenstein!
Interesting 25th Amendment tidbit(s):
"What are considere...
2
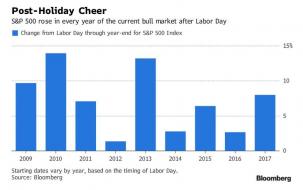
post labor day market surge_0.jpg (827×517)
Thanks Dr. Tim (Is it really different? The Criminal in my White House probably shouldn't nominate a SCOTUS.........
3

1 aug24.png
Thanks @SILVER
@POTUShithole has really lost the plot. He and his DEPLORABLES are finally being shown the Jail....
7
cbo-june-1_thumb.png (692×531)
1
CBO worst case.jpg (890×426)
1
CBO debt to GDP projected.jpg (890×496)
1
interest expenditures.jpg (760×540)
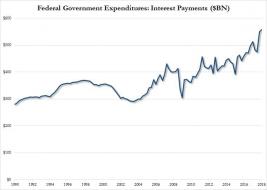
As the following chart shows, US government Interest Payments are already rising rapidly, and just hit an all time...
3
4 may31.PNG
1 may18,.PNG
1
2018-05-11 (1).jpg (890×530)
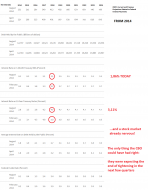
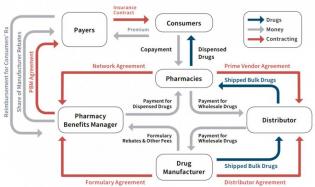
Plan for lowering drug prices
1
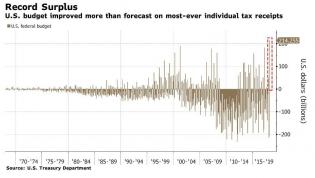
april 2018 budget surplus record.jpg (880×499)
Record budget surplus for government
1
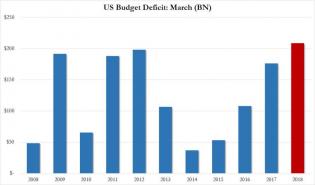
budget deficit march 2018.jpg (890×523)
Biggest March budget deficit in US history.
1
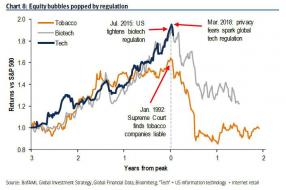
equity bubbles popped by regulations.jpg (705×467)
Government rides to the rescue of the bears
2018-04-09.png (890×585)
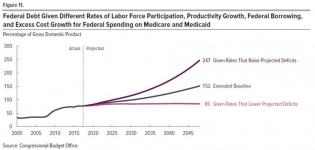
The laughably INSANE basis on which the CBO is modeling the future. TOTALLY INSANE BEYOND ALL COMPREHENSION.
1