User: Hunk of Junk: Equity Indices
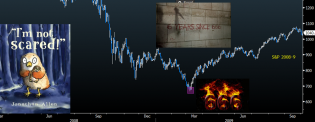
6years.png
In an unfortunate confluence of events we discover that today is the sixth anniversary of the 666 S&P low coming r...

3
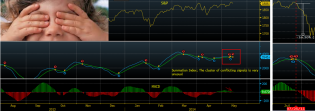
Summ15.5.4.png
In the last four sessions the Summation Index on the McClellan Oscillator has generated a sell signal, then a buy...
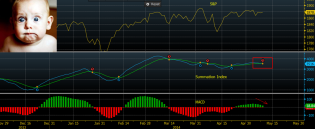
Summ12.5.2.png
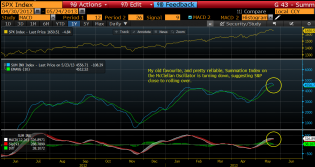
Summation Index turns down; just another indicator telling us that fewer and fewer names are keeping the main indi...
2
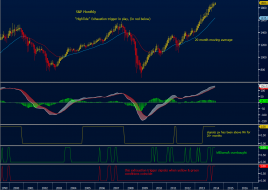
HighTide6.5_001.png
S&P Exhaustion Signal (Monthly)
I'd be lying if I said this was all my own work; it's adapted and has a good hi...
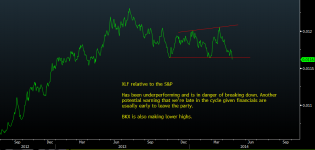
XLF29.4.png
Financials flashing
4
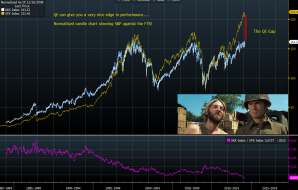
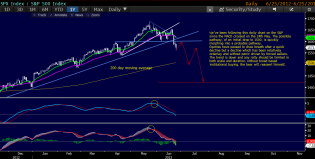
QEGap3.png
a nice edge.......
1
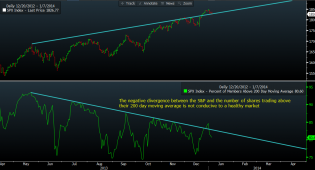
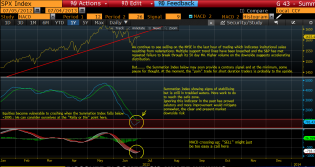
S&PDivergence7.12.png
Negative divergence with number of S&P names trading above their 200 day and the S&P is self evident.
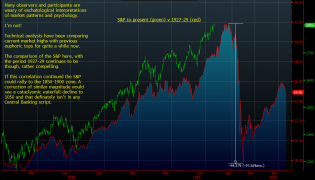
S&P1929.png
S&P; eschatologically speaking.
4
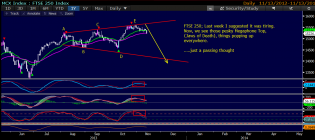
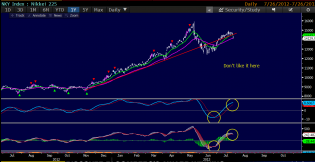
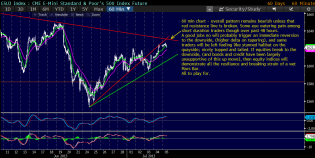
MCX13.11.png
UK midcaps looking shaky
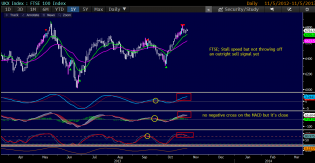
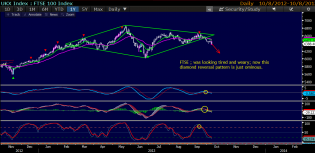
FTSE5.11.png
FTSE; Like many indices, it's moving at stall speed
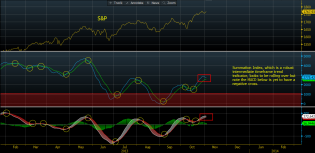
Summ5.11.png
Summation Index; in the zone of indecision.
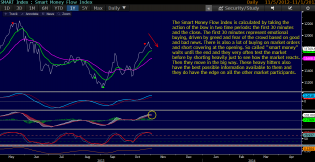
Smart4.11.png
SMART Money Flow Index
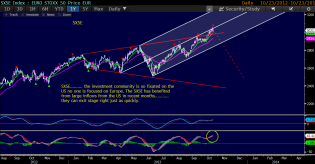
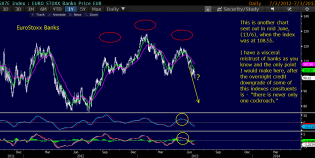
SX5E22.10_001.png
SX5E; more fun with pitchforks
UKX8.10.png
2
SXAE26.7.png
SXAE, (Auto’s), is punching new all time highs and is up 32% in 3 months. Momentum is stalling though and a dece...
NKY26.7.png

US23.7.png
now that... is a bit weird
1
ESU35.7.png
Quick look at where we are..........
2
Summ4.7.png
Europe has seen a strong reflex rally today supported with institutional muscle.
On going selling in the last hou...
1
Banks3.7.png
SPX25.6.3.png
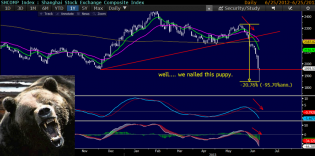
SHCOMP25.6.2.png
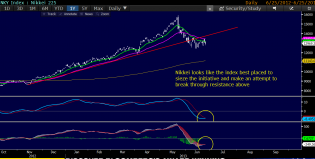
Nikkei25.6.png
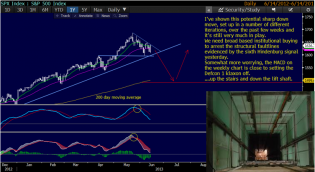
SPX14.4.png
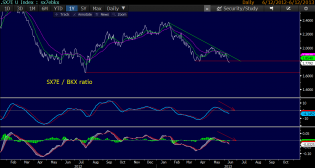
SX7EBKX12.6.2.png
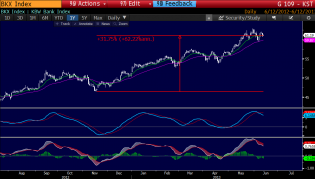
BKX12.6.png
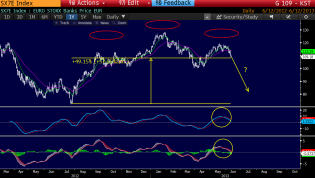
SX7E12.6.png
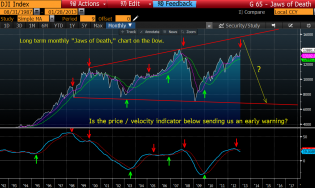
JofD10.6.png
sub.png
Summ24.5.png