View: Summ15.5.4.png
Summ15.5.4.png
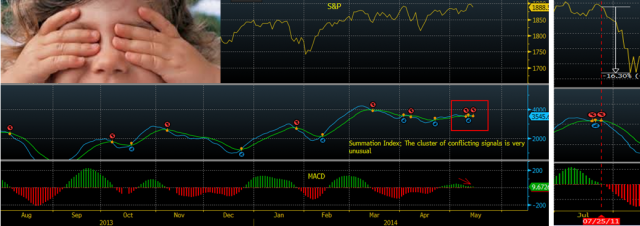
In the last four sessions the Summation Index on the McClellan Oscillator has generated a sell signal, then a buy and then a sell last night. That kind of indecision is very unusual. The last time it chopped and changed with that frequency was in July 2011; the S&P then fell 16%, (zoomed in, above right). This is yet another signal of a fractured market and fits with the first Hindenburg signal from last Wednesday, (and sector & index divergences), but which has still to be confirmed with a second signal.
Comments
No comments yet.


