Browse Symbol Stacks: SPX
aaii
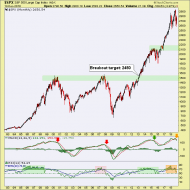
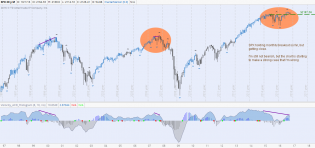
Mom & Pop have jerked over-bullish. Not a to the minute timer, but a bearish condition in place for the market.

2
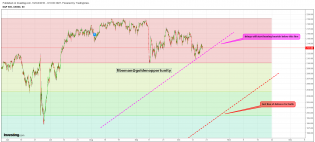
Weakness Appears To Be Setting For This Weeks Economic Data –...

Stock Market & Flu Breakdown Metrics – Where’s The Bottom?...
1 new message
2020 – A Close Look At What To Expect – Technical Traders Ltd.
A Combination Topping Pattern Is Setting Up – Technical Traders Ltd.
1
January 2018 Stock Market Repeat – Yikes! – Technical Traders Ltd.
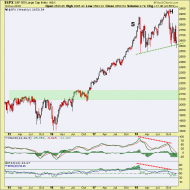
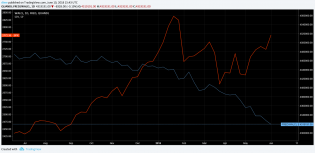
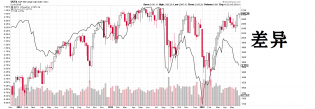
spx and yield curve
Last summer the media got the public puking about the inverted yield curve. They puked the market too. Now, the MS...
2
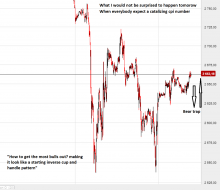
spx
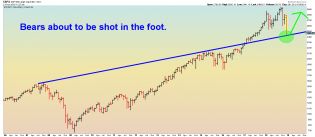
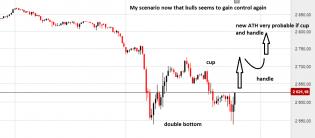
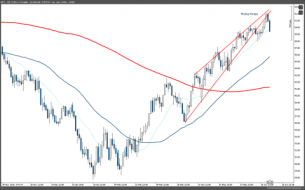
Plan to close out Christmas Eve 2018's crash with a bull extension this year almost too perfect. So much so that i...
1
US Stock Market Leadership Chain Fully Intact | Notes From the R...
Per NFTRH 581's Market Internals segment (partial view)...
sox ndx spx
Stock market leadership chain fully intact as we look to close out the Christmas Eve massacre of 2018.
Current Equities Rally Similarities To 1999 – Technical Traders Ltd.
Gapping Rotation in SPY and News Based Rallies Are A Warning –...
spx
SPX has a crap ton of support at 3020 to 3030.
spx and inverse hui
SPX and HUI working very well as balance to each other lately. Shown here is SPX w/ inverse HUI (15 min. chart).
spx
No bull trap on this in-day reversal unless SPX drops further than just the opening gap fill. Trend still up. 30 m...
Mother Russia Could Soon Be US’s Daddy – Notes From the Rabbit Hole
I've been long Russia the majority of the last year, and now it's threatening greater out performance vs. the US.
spx
Answer upcoming... point #5 a bull turnstile or bear reversal?
1
Black Monday 1987 vs 2019 – Part II – Technical Traders Ltd.
spx
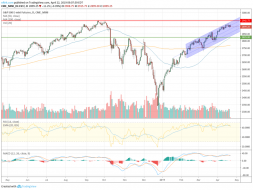
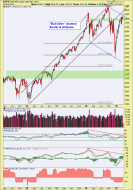
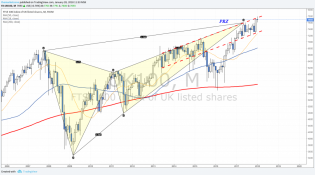
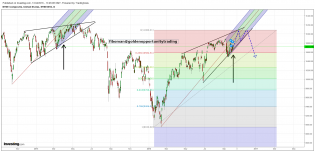
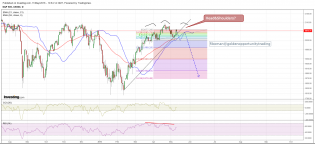
...but weekly SPX is possibly an epic suck-in of the FOMOs at point 5 of the reverse symmetrical triangle. Look at...
1
spx
SPX is above all key support with only the previous high standing in its way.
1
fdn
Internet and related stuff (FDN) targets a test of the Dec. 2018 lows (as does the broad market if SPX loses Aug....
spx
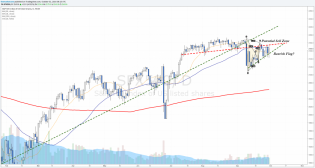
The 5th reversal point on the reverse symmetrical triangle (megaphone) was a bull trap. We've carried this pattern...
1
My index trend and trading strategy signal – Technical Traders Ltd.
s3.amazonaws.com/cdn2.soci..._7ZdN5F_l.png
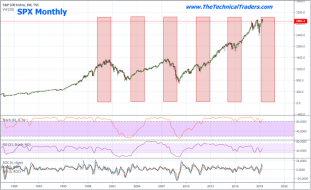
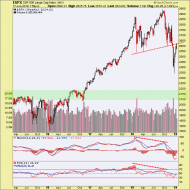
SPX monthly
1
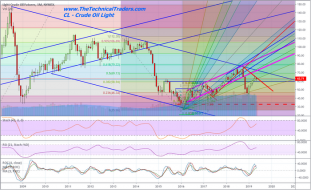
Oil, Hot Stocks, and Currencies – Part III – Technical Traders Ltd.
2
Trade Issues Will Drive Market Trends – PART II – Technical...
spx
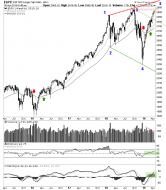
USS Good Ship Lollypop fills breaks trend line (not shown), fills gap and approaches support. Uptrend intact, desp...
1
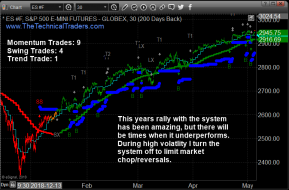
Index Trading Signals for Momentum, Swing, and Trend Following...
spx
ES is just below top-test resistance. Lateral support, SMA 50 & fork bottom all in same area. RSI & MACD not attractive.
spx
SPX Megaphone. Will it reverse this pig after a new high?
2
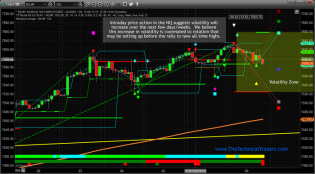
Intra-day Fibonacci Modeling Shows Volatility Is About To Spik...

gld spy ratio
Gold is constructive at least to end its consolidation vs. SPX (GLD/SPY). But the bears go nowhere unless this bre...
spx
I am leaning bear at this decision point. But the pig has to crack support first.
1
Market Week Ahead – Notes From the Rabbit Hole
Today is just a pullback to fill a gap. No bear resumption until support & SMA 50 lost.
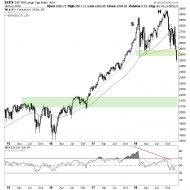
SPX ‘M’ Top and What Has Come After – Notes From the Rabbit Hole
From the original post this chart is clipped from... "unless several other factors we are watching flip, the stock...
SPX and Gold; Pivotal Points at Hand – Notes From the Rabbit Hole
SPX bounce... fail now or make bear case uncomfortable.

spx
SPX moment of truth comin' up.
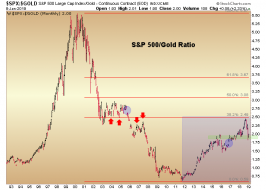
spx/gold ratio
Market bounces from a logical area, even by the SPX/Gold ratio. But lower gap could fill. Pig not out of the woods.
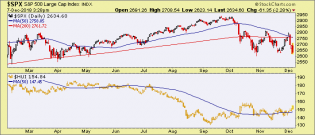
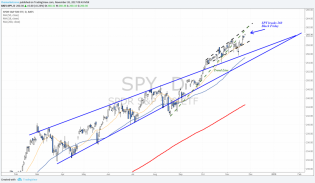
sc (1565×681)
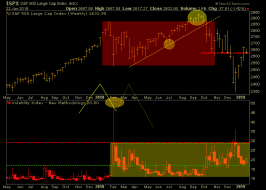
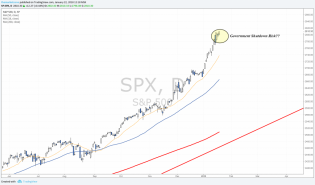
SPX - monthly.

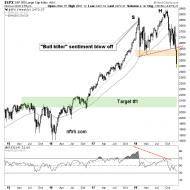
Is This Risk ‘Off’ Enough for Formerly Greedy Bulls? – Not...
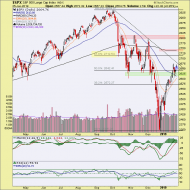
Did not expect target #1 to register any time soon. Note to self... think again. Had expected a Q1 grind before target.
1
A Bad Look for SPX – Notes From the Rabbit Hole
Err, not a good look SPX.
How Low Could the S&P 500 Go? – Notes From the Rabbit Hole
How low can the S&P 500 go? Possibly a take back of the 2013 blue sky breakout?
How Low Could the S&P 500 Go? – Notes From the Rabbit Hole
How low could the S&P 500 go? A piece of cake decline to 2100?
Rut… No, Not Yet – Notes From the Rabbit Hole
RUT/SPX leadership should be watched. It's firmly down trending.
1
Rut… No, Not Yet – Notes From the Rabbit Hole
SPX held support as expected, but chart is brutal. Death Cross hype brings a bounce every time.
1
Gold Stocks Acting as they Should During Market Stress – Notes...
So what have we got in play today? Beuller?
Gold Stocks Acting as they Should During Market Stress – Notes...
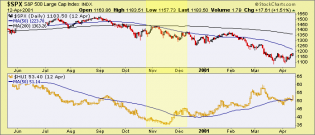
SPX & HUI in 2000...
2018-12-06-2
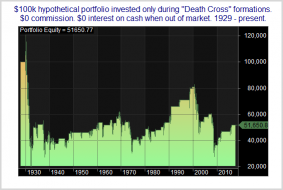
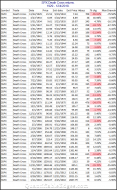
90 years of Death Crosses (cont.)...
1
2018-12-06-1
90 years of Death Crosses...

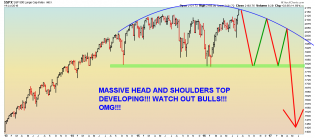
A Man Who Stares at Charts Sees H&S! – Notes From the Rabbit Hole
Man stares at chart, sees upside for balance of 2018 into 2019. Then he sees a nice downside target.
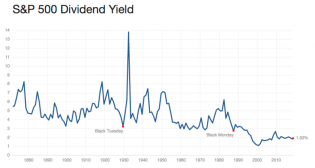
A Brief Look at Earnings Season and a Measure of SPX Over Valuation...
Picture of SPX over valuation. SPX dividend yield of 1.92% vs. 10yr T note yielding 3.2%!
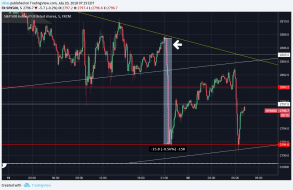
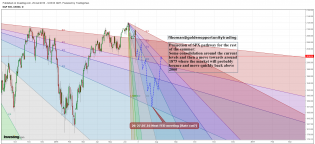
87N7Y5HE (1087×704)
Markets jolted last night by another mini 'flash crash' with /ES plunging more than a half percent in minutes....

3

s3.amazonaws.com/cdn2.soci..._6Vz4xC_l.png
Ndx skew

6xmnGLc1 (1444×703)
Tug-o-war : SPX vs Fed unwinding the balance sheet.
1

1 feb16.jpg
https://www.youtube.com/watch?v=6WQjgHuUDWU

1
1 feb13.PNG
2
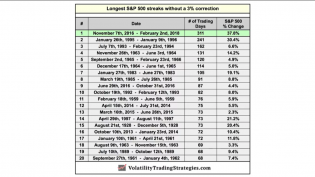
image.png
Logest periods of time without a 3% correction in S+P
6 feb9.jpg
2

5 feb9.jpg
4 feb9.jpg
3 feb9.jpg
2 feb9.jpg
2
1 feb9.jpg
2
weekly markets analysis
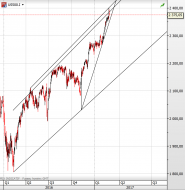
UK100 - Re-test of PRZ and trading channel top

Weekly Markets Analysis
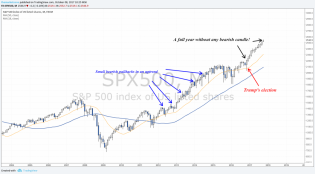
SPX failed Outside Bar pattern
Weekly Markets Anlaysis
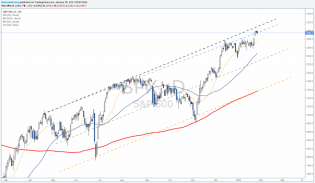
SPY - Broadening Top, Bollinger Bands, RSI - All signs indicate that we won't see Year End Rally this year... but!
weekly markets analysis
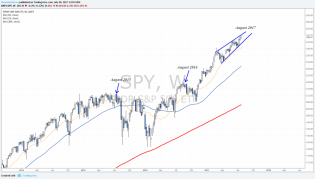
Crazy uptrend in SPX
weekly markets analysis
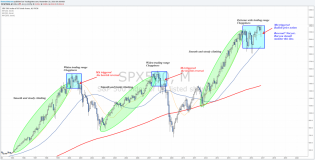
SPX continues to rally as the market waits for the Fed
2
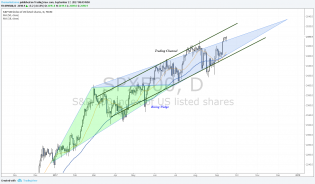
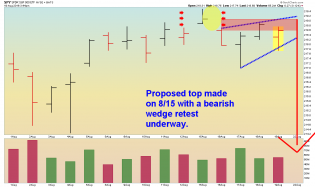
weekly markets analysis
Doji pattern after testing the top of a weekly wedge.
Will it be enough to stop SPY? Also in this week's newsletter...
weekly markets analysis
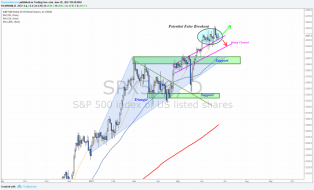
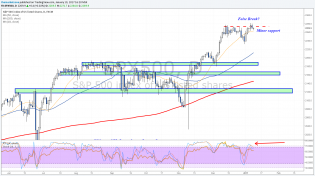
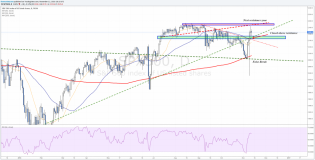
S&P500 continues to consolidate at all time record highs. False Breakout of a bullish continuation move? Read more
1
weekly markets analysis
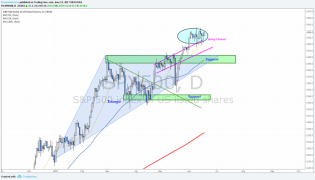
The S&P500 is aiming to set new record high... will it?
1
Click to enlarge
New trading lesson explaining Butterfly patterns
9 mar3.PNG
1
8 mar3.PNG
weekly markets analysis
SPX reached the top of a trading channel
Weekly analysis - Preparing for Trump - TheMarketZone
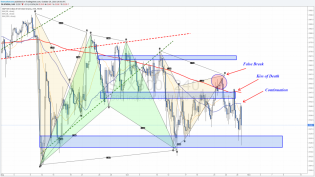
Potential False Break scenario... or Buy the Dip - See more
Weekly Markets Analysis
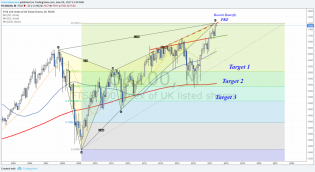
SPX analysis toward 2017 - Still more upside potential but limited
SPX analysis
SPX near previous record highs. DIA near completion of bearish Bat and the Dollar Index (DXY) near 100$ - Post ele...
3 nov11.PNG
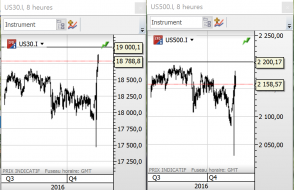
S&P500 and dow jones (cash markets)
I believe there's almost zero probability that we reverse course before at le...
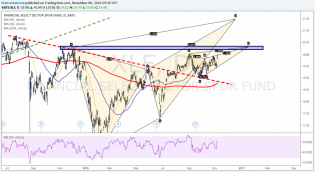
XLF analysis
Special markets review towards the U.S elections
1
weekly markets analysis
Using MA lines and Trend lines - SPX
Weekly Markets Analysis
SPX.png

spx 19.10.16.png
spx

weekly markets analysis
Potential Bear Flag in $SPX? Read more in this week's analysis
nya 01.10.16.png
eerie similarities...
1
spx 13.09.16.png
SPX: Is the current upmove dead?
1
SPY - Daily - 8.19.16.png
SPY - daily chart. This is not investment advice.
2
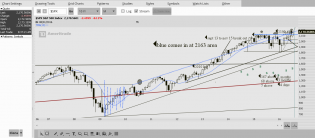
2016-07-21-PROPHET 2010 line 2163 cash.png

2016-07-19_SPX.png
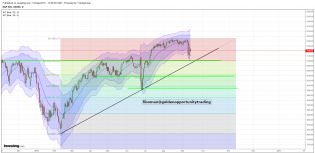
Note the blue line. Notice what happens when price gets too far away from the blue line. Any Questions?
3
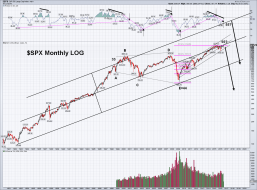
SPX Monthly.png
SPX Montly LOG: Bullish of Bearish??
For the bulls: 1. Very long term trend UP. 2 Intermediate term trend UP...

5
SPX - Weekly - 7.15.16.png
Sarcasm or not? You decide.
3
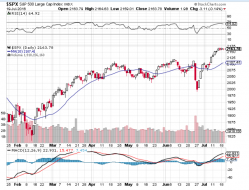
spx.png
I can't see anything that says SPX is going very much higher during the summer vacation. Can you?

1
SPX summer 2016.png
BREXIT, Yellen and the morning after pill
1
Weekly canles suggest more downside ahead.png
Notice the weekly candle formation for some of the major indices. This is also my current view of what I see as a...
1
Yellen presents.. always look at the bright side... • The Market Zone
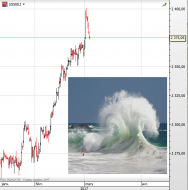
Oil closes below 50$ after hitting this rising wedge. Weekly Markets Analysis
20160602cyb_spx.png
Divergence between CNYUSD and SPX. Rate hikes will put greater downward pressure CNYUSD

2
Structure Analysis for Silver • The Market Zone
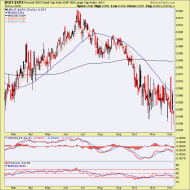
$SPX below the 50 days MA - Will it reach 2000 by the end of May?
spx 11.05.16 (2).png
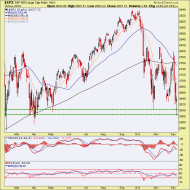
SPX: H&S???
14624908581491312912890.png
2