View: SPX Monthly.png

SPX Monthly.png

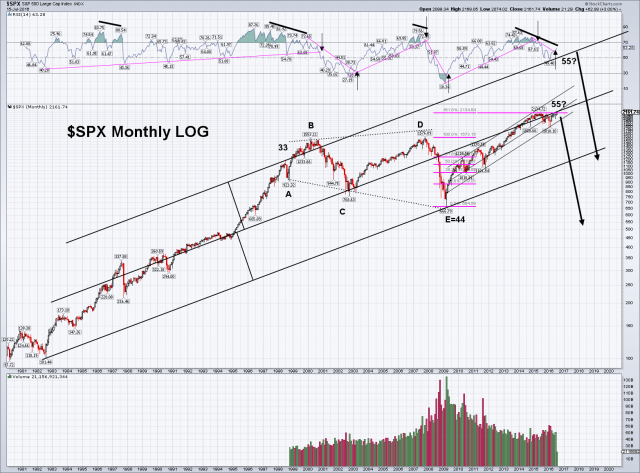
SPX Montly LOG: Bullish of Bearish??  
For the bulls: 1. Very long term trend UP. 2 Intermediate term trend UP. 3. Short term trend UP . 4. RSI monthly trend going up.  
Hope for the last few bears left in this world: 1. Price is at the mid channel line on both the very long term channel and the intermediate term channel. 2. Price is at the 1.618 level of the expanding triangle. 3. There is a strong bearish divergence in the monthly RSI. 4. The world appears to be going into total chaos. 5. It would make Tim, Tom, and Leonardo Fibonacci happy.  
Have a great trading week.  
Tomb

Comments

DinkDink
My only problem with your chart is the use of log. Despite what TK claims, log charts are 7/18/16
DinkDink
...NOT necessarily any better than arithmetic charts. How do I know this? Well, take off the log option on this chart and redraw your trendline from the 1982 low and something amazing happens. You get several touches of a rising trendline from 1982 and guess where the most recent touch was...2009...exactly at the low! Coincidence? I think not. 7/18/16
DinkDink
Also, something to remember about RSI. In strong uptrends with no top, RSI divergences only lead to a decline to about 40-50, usually. At actual tops, the RSI will drop to oversold, but in strong uptrends with no top, RSI will only reset at around 50. Using that rule, and assuming no major top is in, then RSI has already reset and ready for another ramp higher. 7/18/16
TombTomb
Dink thanks for taking the time for the feedback and suggestions. 7/18/16
7/18/16
...