Browse Stacks: Patterns: Cycles
SPX-September-Monthly-Performanc (1).jpg (806×476)

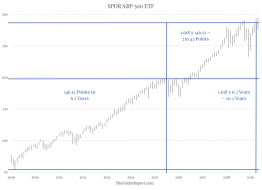
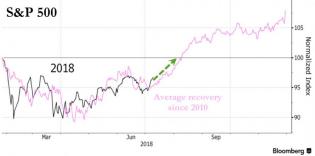
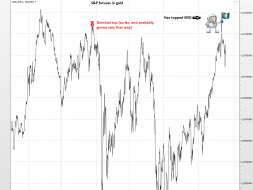
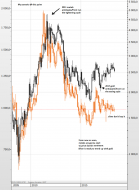
slopechart_SPY.jpg

1
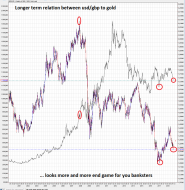
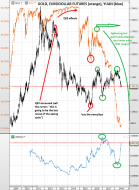
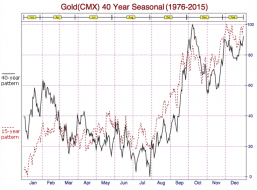
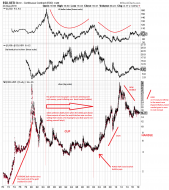
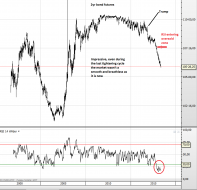
slopechart_/HG//GC.jpg
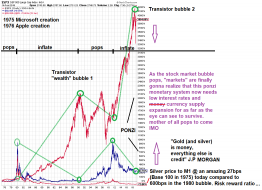
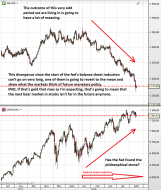
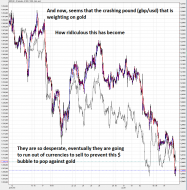
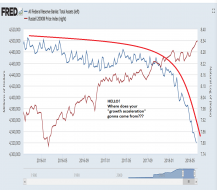
cycle aberration, or is copper going to catch up?

Presidential-Elections-Stock-Mar (1).jpg (831×513)
2
2024 seasonality.png (909×573)
2JUN19.png

4
1JUN19.png
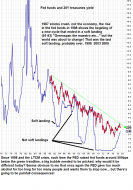
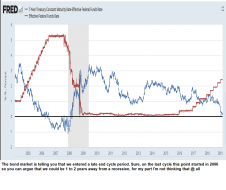
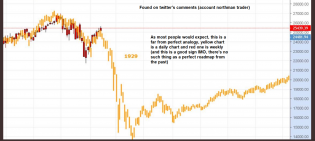
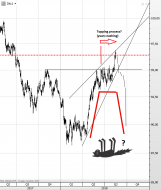
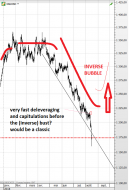
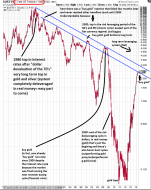
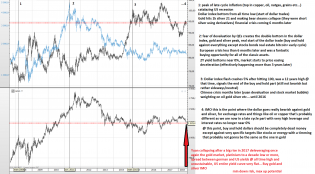
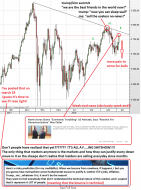
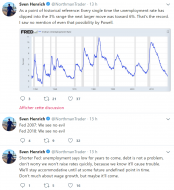
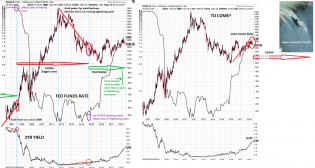
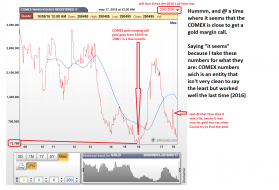
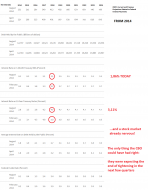
End of an era precursor?
2JUN18.png
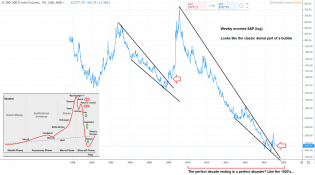
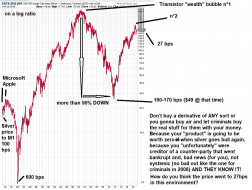
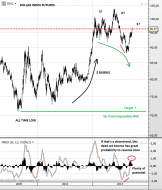
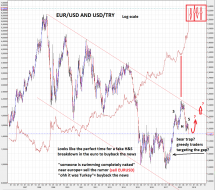
Both can't be right, can't see how it would be possible!
2
2021-11-18_12-16-02.jpg (1280×837)
1-10.jpg (968×772)
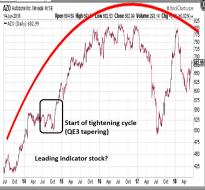
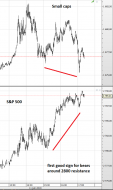
Semi sector ready to fall
bfm230F_0.jpg (1009×581)
Investor-Psychology-Cycle (1).jpg (600×500)
1
august worst seasonals_0.jpg (694×499)
Entering The Worst Seasonal Period Of The Year... Which Ends With Jackson Hole
4
Scurve-empires3-19 (1).png (500×400)
2
s3.amazonaws.com/cdn2.soci..._PeA2aG_l.jpg
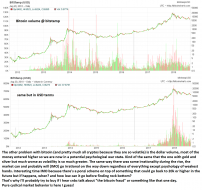
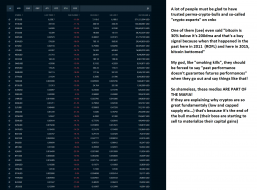
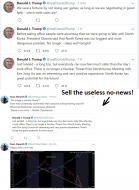
What good is a chart if things do not repeat that can be taken advantage of? Given the current crypto market, I th...

2
Bofa investment clock.jpg (774×539)
Scurve2-17_7.png (500×400)
4-cycles2_1.png (550×370)
EcP2nw-WkAA4fls.jpg (1200×849)
1
Presidential-Election-Year-Returns-091720-2.png (829×507)
1
China credit impulse 7.17.jpg (971×542)
slopechart_SPY.jpg
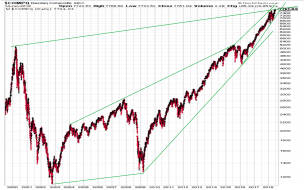
101-yrs-7.5-trendline-5-13-20.png (1280×720)
2
Secular-bull-bear-bar-chart-5-13-20.png (1280×720)
1
SP500-FullMarket-Cycles-040620-2 (1).png (950×572)
1
2 feb14.PNG
1 feb14.PNG
1
s3.amazonaws.com/cdn2.soci..._RwPWyY_l.png

1
1 jan16.PNG
3
nom5_2.jpg (898×362)
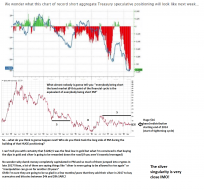
MW-GO827_sept_d_ZH_20180823094505.jpg (890×501)
September is the weakest month for equities
1
img-01-1-881x618.png (881×618)
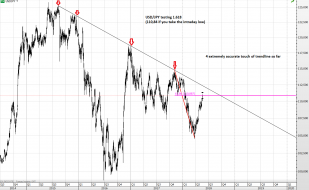
spy 1.618.png (1024×742)
2 feb18.PNG
1
9 feb17.PNG
2 feb17.PNG
1 feb17.PNG
2
3 feb15.PNG
2 feb15.PNG
Image_4_20190201_TFTF.png (630×347)
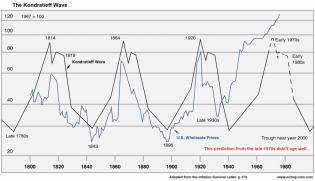
1-K-wave-768x443.png (768×443)
3 jan12.PNG

3 nov9.PNG

1 nov11.PNG
1
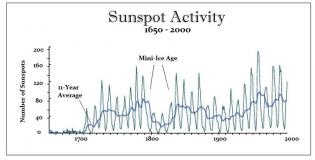
Sunspot-Activity-1650-2000_0.jpg (890×454)
1

cartoons.jpg

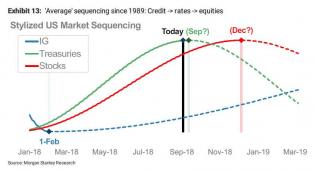
MS when stocks peak.jpg (831×449)
Morgan Stanley sez top is December of this year.
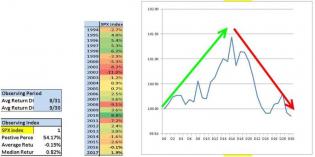
seasonal sept.jpg (890×444)
This is what the seasonal performance for September has looked like over the period 1994-2017
7 aug31.png
6 aug31.png
2
2 aug21.PNG
1 aug17.png
15 aug16.png
14 aug16.png
8 aug16.png
7 aug16.png
4 aug10.PNG
1
6 aug8.PNG
(fyi, $shit is the cnbc ticker) ;)
4 aug8.PNG
3 aug8.PNG

8 aug1.PNG
2
6 aug1.PNG
1 aug1.PNG
5 july30.PNG
2
4 july30.PNG
3 july30.PNG
2 july30.PNG
4 july20.PNG
s3.amazonaws.com/cdn2.soci..._aF1uRy_l.png
RESTACK
btw thx to the poster for that chart

3
3 july20.PNG
1
3 july18.PNG
1 july18.PNG
3
2018-07-09_9-30-06.jpg (890×443)
Seasonality
1 july7.PNG
1
8 june15.PNG

7 june15.PNG
2 june15.PNG
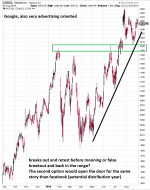
Nasdaq composite in long term parabola
sustainable?
2 june14.PNG
5 june13.PNG
3
3 june13.PNG
3 june11.PNG
2
2 june11.PNG
1 june11.PNG
3 june1.PNG
2 june1.PNG
1 may30.PNG
2 may24.PNG
2
7 may23.PNG
2 may23.PNG
6 may21,.PNG
2 may21.PNG
1 may21.PNG
11 may18.PNG
10 may18,.PNG
9 may18,.PNG
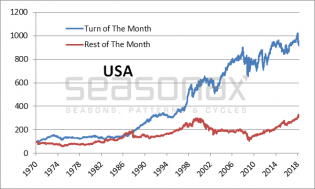
11-usa.png (601×361)
Investing at end-of-month versus other times: United States
1
4 may18,.PNG
3 may18,.PNG
1 may18,.PNG
1
10 may17.PNG