Browse Symbol Stacks: $COMPQ
3JUN18.jpg

slopechart_$COMPQ.jpg
RUT is worse. SPX ain't there yet.

slopechart_$COMPQ.jpg
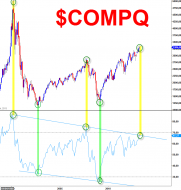
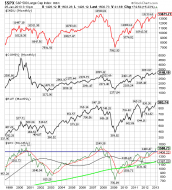
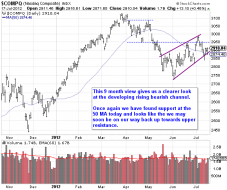
Dovetailing on @NYUgrad chart from earlier today. Long term COMPQ with 3 historical significant touchpoints to tr...
1
slopechart_$COMPQ.jpg
a couple of decent supports under current price
three point trendline and 4 point resistance turned support horizontal

slopechart_$COMPQ.jpg
Ascending triangle.
Attractive spot to go long, if you're into that sorta' thang. Tight stop around 13000.
slopechart_$COMPQ.jpg
Gap resistance. Not a bad place to short with that bearish engulfing candle from Tuesday. Well defined stop at Mon...
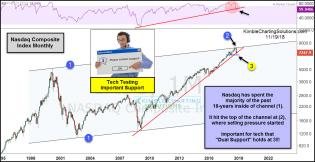
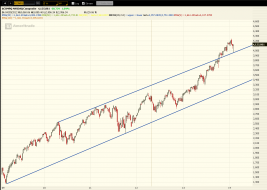
nasdaq-composite-testing-9-year-rising-support-nov-19.jpg (1230×636)

1
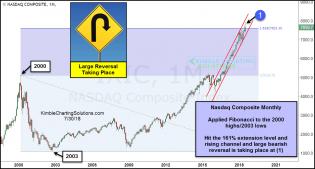
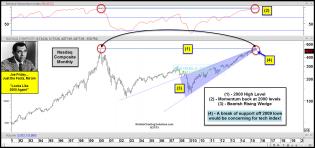
nasdaq-comp-creating-large-bearish-reversal-at-161-fib-level-july-3...
Nasdaq creating large bearish reversal related to 2000 highs!
1
slopechart_$COMPQ.jpg
Follow, Like, Tag, Share blah blah blah. We are growing up with a majority that is brittle and have no self worth,...

1
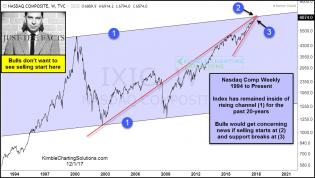
joe-friday-nasdaq-comp-doesnt-want-to-see-selling-start-here-dec...
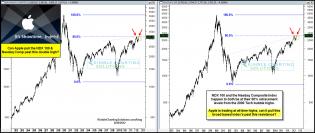
Tech bulls biting nails at this price point
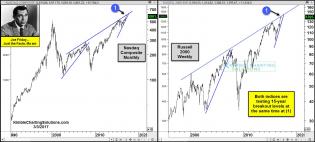
joe-friday-nasdaq-and-russell-testing-15-year-breakout-levels-march...
Nasdaq & Russell attempting 15-year breakouts
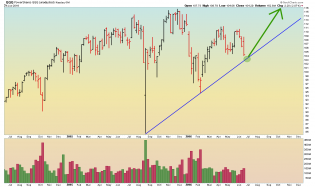
QQQ - Daily - 6.27.16.png
QQQ daily. This is not investment advice.

3
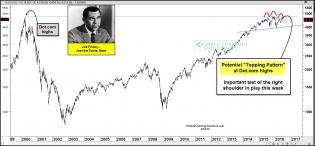
joefriday-ndx-at-right-shoulder-june-10.jpg (1574×731)
Topping pattern on the NASDAQ
1
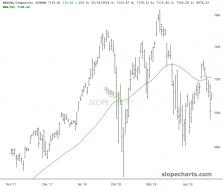
sc (1).png
My popcorn is ready
compq6.png (1958×1440)
The NASDAQ Composite is, ummm, a little toppy.
1
compq2.png (1962×1430)
The kiss of death
1
joefridandxyimportantkissofresistanceoct23.jpg (1573×735)
NASDAQ hits underbelly of broken trendline.
3
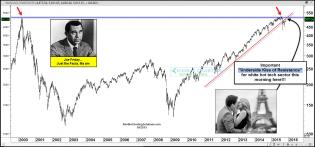
original_41651387.jpg (1574×740)
The VERY big picture of the NASDAQ Composite
1
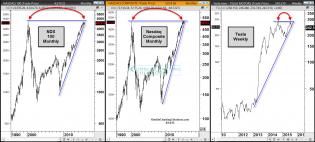
ndxnastsladoubletopsaug14.jpg (1566×708)
Gargantuan long-term double-tops in play
2
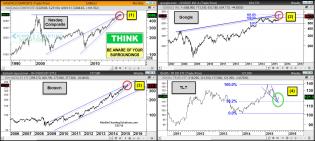
nasgoogbiotltbeawareofsurrondingsjuly27.jpg (1570×706)
A quartet of interesting instruments
1
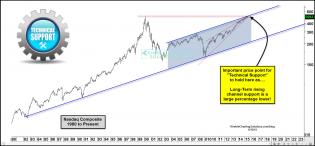
nasdaqcompositetechnicalsupportneedstoholdjune12.jpg (1571×733)
Mega-wedge for the NASDAQ
nasdaq.png
Nasdaq Vs Dollar. Head Shoulder Top. The time has come.

$NASIT ema4 long termsc.png
I personally think the QQQ is likely starting a major C wave down. Here is a long term chart of the NASIT (day ema...

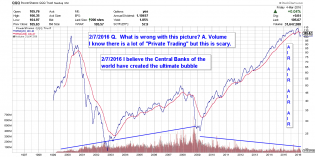
2014-02-07_$COMPQ.png
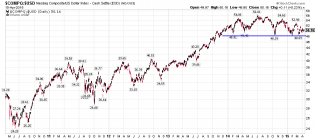
Nasdaq Composite $COMPQ 5 year channel retest
etf-corner.com/.a/6a010535...b73001970c-pi
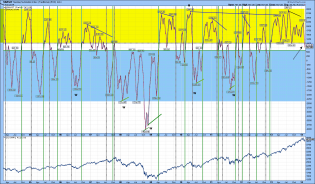
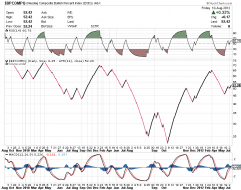
$COMPQ and monthly RSI from Serge...

SPXmonthly-voyeur8.png

content.screencast.com/use...OMPQ11413.gif
COMPQ 5 Year Weekly Chart
Very overbought with multiple negative divergences.
ndxnascompat50percentfiblevelsaug28.jpg (1561×663)
The NDX and COMPQ are both at their 50% retracement levels - an amazing chart!
$BPCOMPQ
Successively lower highs, S/T still more room (renko chart)

NASDAQ 071712
