Browse Symbol Stacks: $COMPQ: $NASIT ema4 long termsc.png
$NASIT ema4 long termsc.png
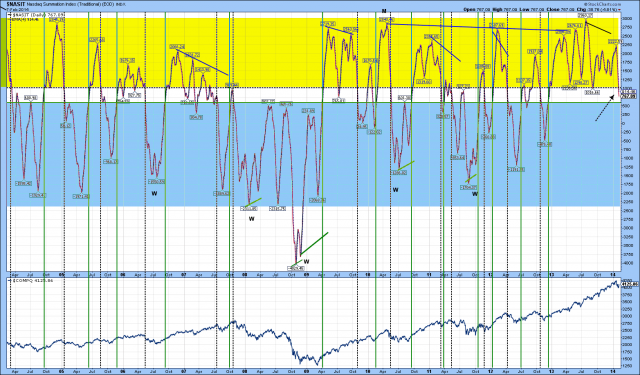
I personally think the QQQ is likely starting a major C wave down. Here is a long term chart of the NASIT (day ema). Most major and intermediate tops have a divergence followed by a drop in indicator to <1000 as we have now. With prolonged downturns it then stays <600. So I like to check it once a week. Stay warm. T.
Comments
No comments yet.


