Browse Symbol Stacks: DIA
slopechart_DIA,QQQ.jpg
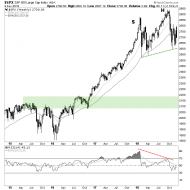
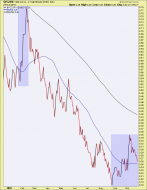
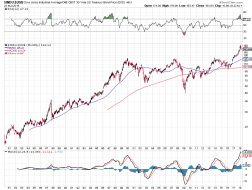
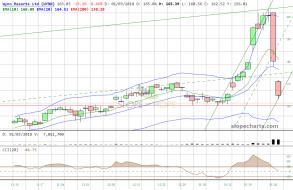
Big Tech and Industrials going separate ways, just like late 1999

3
Capture d'écran 2024-01-29 234311.png
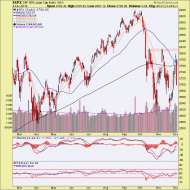
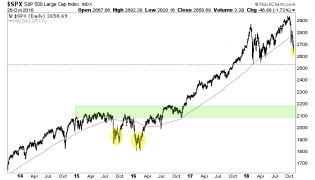
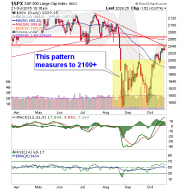
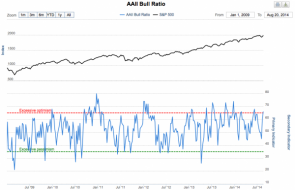
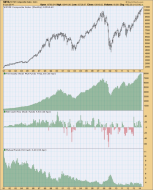
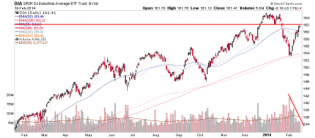
S&P still not at ATH compared to bills and is now facing pot resistance

slopechart_DIA.jpg
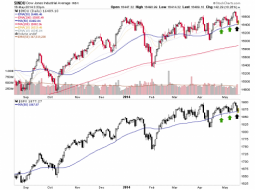
DIA TL rejection

January Payrolls +517,000 | Notes From the Rabbit Hole
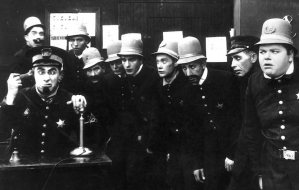
Hazel servicing the guests aboard the Good Ship Lollipop... boy is she ever servicing them!

1
Philly Fed manufacturing survey for december
Philly Fed has decline to the pleasant 'Goldilocks' zone, conveniently during the Q4-Q1 market relief seasonal pha...
m2 money supply
If you are a stock market bull AND you believe there is a correlation between M2 and the SM, you may see the extre...
1
“The Fed is likely…” | Notes From the Rabbit Hole
No hike today, but it's highly doubtful the market correction will bump the Fed off of a hike in March.
1
us stock market
US indexes looking gappy...
Stock market risk not yet realized | Notes From the Rabbit Hole
Valuation? ha ha ha... but it does not matter until it matters (chart from Advisor Perspectives).
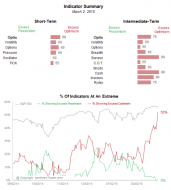
sentiment
Smart & Dumb indicators show little bull refreshing sentiment squalls but also a downward trend in Dumb money bull...
naaim
NAAIM and others (e.g. AAII) take short-term negative sentiment bursts to refresh the bull.
xvg
Median of 1700 stocks potentially rolling over as it diverges the headline indexes.
slopechart_DIA.jpg
For the few brave bears left. Almost back to channel top for touch 3.

slopechart_DIA.jpg
Gets most of the attention but fewer components.

slopechart_DIA.jpg
Positive for the year
slopechart_DIA.jpg
Diamonds sit right on trendline

growth vs. value
While Grandma collects dividends on over indebted crap, growth has established a generational out performance to value.
1
slopechart_DIA.jpg
The Myth of Sisyphus
slopechart_DIA.jpg
Diamonds on the edge
slopechart_DIA.jpg
The month of June so far for the Dow Industrials at 5 minute intervals. Today came close to an upside breakout.
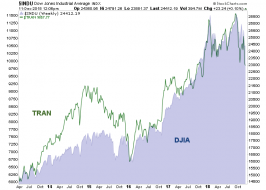
djia
DJIA H&S activating, but it's only a baby w/ a minor downside target. But what about those gaps down below? Beuller?
yield curve
Why I do believe we are witnessing a baby yield curve steepener...
The day the world ended… | Notes From the Rabbit Hole
The world has ended I tell you!... so say the headlines.
1
Gold’s hidden affinity for Treasury bonds | Notes From the Rabbit Hole
A little reminder from the last deflation scare. This is an excerpt from 11/22/08.
Is The Coronavirus bullish for Stocks? – Technical Traders Ltd.

Unstoppable Force (Coronavirus) vs. Immovable Object (Central Ba...
Don't worry bears, stock futures only up 136,000,000%!!! See associated post for more on why CBs stand ready to inflate.
bfmCC52_0.jpg (966×506)
put call ratio
Matter of time before a top says Equity Put/Call. But we may need to see price & momo accelerate in tandem w/ this...
Just a Small Hint, But… | Notes From the Rabbit Hole
Fear not my bearish friends. In January we gonna get Bubba in da house!
2
Maybe the Macro Tourist is Right | Notes From the Rabbit Hole
Hope for the bears, after all.
1
slopechart_DIA.jpg
"next Sports Illustrated swimsuit issue"
Love to see that. Encourage with a Diamond membership! :-)

3
My index trend and trading strategy signal – Technical Traders Ltd.
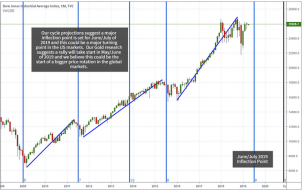
Proprietary Cycles Predict July Turning Point for Stock Market...
June/July Market Top
1
1 feb17.PNG
2
6 feb15.PNG
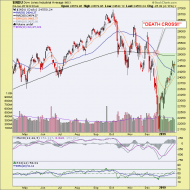
indu
So Bueller, what are you gonna do the next time the media tout a DEATH CROSS? Why of course, you're gonna fade it.

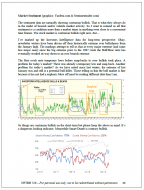
nftrh market internals
Color coded market internals...
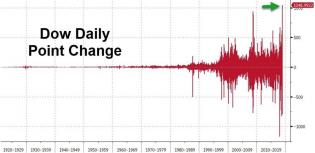
2018-12-26_12-57-27.jpg (890×435)
Today was the biggest Dow Jones point increase IN HISTORY!!!!!
1
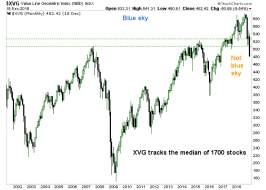
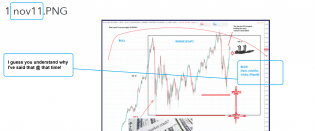
The ‘Man in the Middle’ Loses Blue Sky – Notes From the Rabbit Hole
Lost in all the market's noise, the man in the middle (XVG) lost blue sky before the market tanked. Bad Breadth si...
2 Bearish Indicators – Notes From the Rabbit Hole
Bearish indicator #1 (among many).
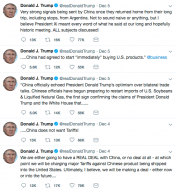
A Tweet, a Jawbone, a Policy Notice or… ? – Notes From the Rabbit Hole
Dear Mr. Trump, the stock market needs you to pleasure it with more than this lame pap. Key support is at hand, af...
Weekend Analyst: A, In-Week Trader: C- – Notes From the Rabbit Hole
Here is what concerned me. Daily chart 'W' pattern would have targeted new highs had it not getting smashed. Daily...
1
Weekend Analyst: A, In-Week Trader: C- – Notes From the Rabbit Hole
The volatile grind actually helps keep the favored H&S alive. If market had continued to rally it would have wreck...
1
Weekend Analyst: A, In-Week Trader: C- – Notes From the Rabbit Hole
Got the main analysis right but even these guys are trading better lately.
A Polar Opposite Sentiment Swing – Notes From the Rabbit Hole
Why, just 3 days ago this is what casino patrons were treated to. https://nftrh.com/2018/11/28/why-a-bounce/
4
A Polar Opposite Sentiment Swing – Notes From the Rabbit Hole
Polar opposite sentiment swing from just 3 trading days ago.
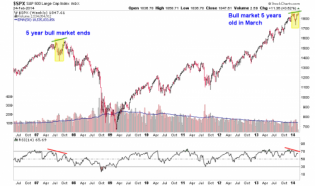
slopechart_DIA.jpg
DIA 5Y chart. This date highlighted. Not ready to call this a bear market yet.
1
nftrh 526
From Nov. 18th NFTRH... sentiment has been S/T over bearish and looking for a match, but long-term dangerous.
Garth! – Notes From the Rabbit Hole
So, is this cycle going to be different from the last two? And if so, why? Party on Garth... very temporarily.
A New NFTRH Segment: Opening Notes – US Stock Market – Notes...
Pending bounce back rally for Nov./Dec. when SPX breaks the February low 2100-2200 will be locked and loaded, eras...
yield curve
Market bulls should be wary of the yield curve's slow grind this time as opposed to Feb's big spike (which was a b...
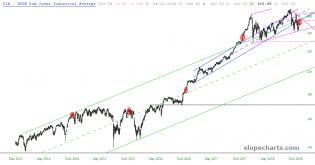
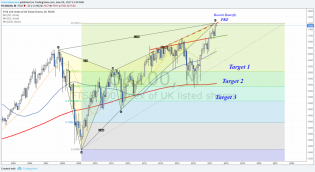
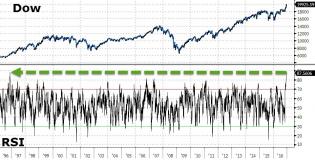
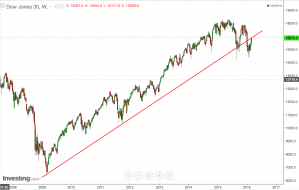
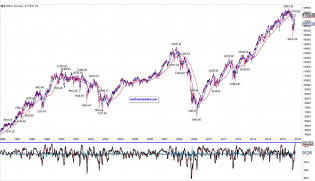
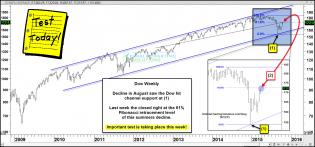
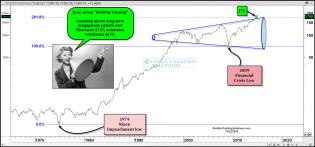
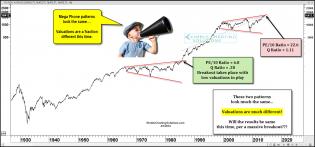
dow-testing-top-of-70-year-channel-after-megaphone-breakout-july-31...
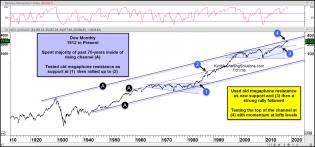
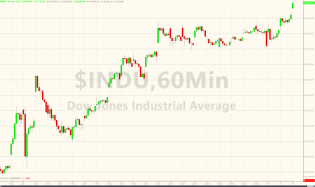
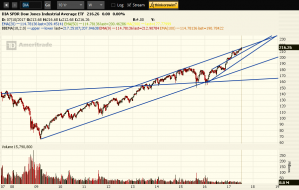
Dow Jones Industrials Bumping Into 70 Year Channel Resistance
2
2018-06-21_10-18-34.jpg (769×552)
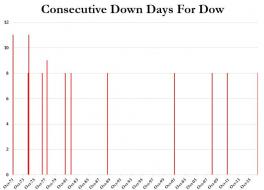
There has not been a longer Dow losing streak since 1978!!
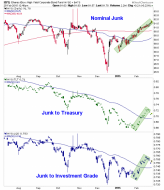
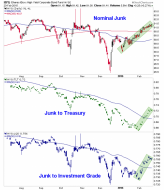
20180326dow30bond30.png
1987 or 1998 take your pick.

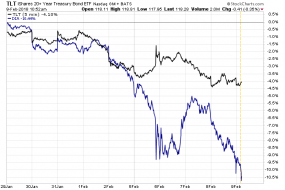
20180209dia_tlt.png
Bonds and stocks are having an on again, off again relationship.
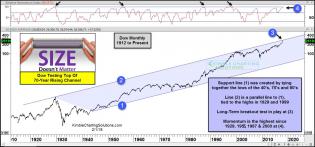
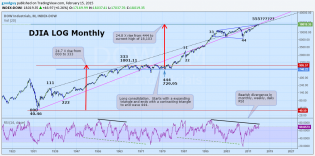
dow-testing-top-of-70-year-channel.jpg (1569×734)
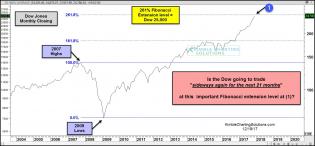
Below looks at a chart on the Dow since the early 1900’s on a monthly basis, with momentum applied in the upper...
3
slopechart_FOXA.jpg
/ym less than 20 points to 400. Cash not far behind.
Memo Shmemo

32
slopechart_WYNN.jpg
/YM only 100 more to go between "friends"
50

unnamed.png.jpg (786×542)
Anyone else taking the 70% guaranteed Friday odds for positive? /ym 26K is very close. Cash even closer.
What i...
14
20180104_25k3.png (890×529)
And The Dow tops 25,000 - the fastest 1000-point leap in history, as the Dow first crossed 24k on 11/30.
dow-testing-261-extension-level-going-to-trade-sideways-for-next-21...
Dow-Poised to trade sideways for 21 months again?
1
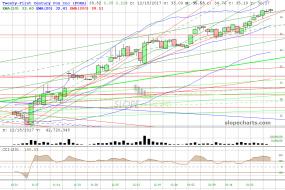
2017-07-15_DIA.png
DIA weekly testing 8 year resistance trend line
Click to enlarge
New trading lesson explaining Butterfly patterns

1 mar17.PNG
Markets are coming back to a "normaler" state.......for the first time @.....these prices, wich could be a very ba...
2
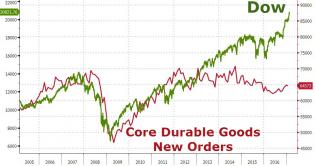
20170227_durgoods3.jpg (964×511)
Market divergence #9,839,923 - durable goods versus the $INDU
1
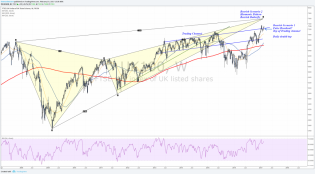
click here to enlarge
2 bearish scenarios for UK100 in this week's weekly analysis. Also bearish scenarios for German DAX and DIA
20161213_EOD8.jpg (960×489)
The Dow has now been overbought for 23 days in a row...at the most overbought in 20 years...
5
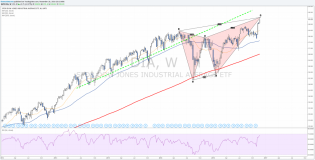
Weekly Markets Analysis
The Dow is near the completion zone of a weekly a bearish pattern
1
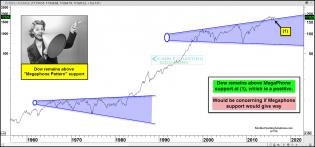
dow-mega-phone-support-pattern-june-7-2.jpg (1570×734)
Dow megaphone pattern
1
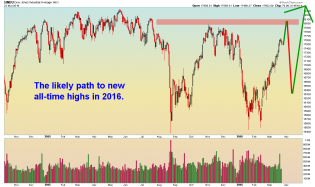
$INDU - Daily - 3.23.16.png
DOW - Daily. This is not investment advice.

6
ym-weekly.png (1986×1258)
Dow weekly chart quite plainly has broken its trendline
DOW - Weekly 1.27.2016.png
DOW weekly. This is NOT investment advice.
3
DJIA - Weekly 1.20.16.png
This is not investment advice.
2
DJ Small cap.png
DJ Small cap: A very nice H&S

1
djia-macd.png (2448×1412)
Highest. MACD. **EVER**
2
s&p 500 daily chart
Who wins S/T, 2040-2060 resistance or pattern measurement
dowimportanttestoffib61leveloct19.jpg (1570×734)
Key test for Dow Industrials
2
naiim, market sentiment
NAAIM Investment Managers now 75% cash and have been 70% to 100% cash at every bottom.
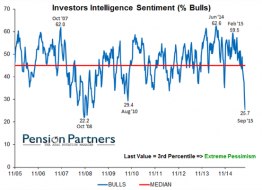
investors intelligence, market sentiment
Newsletter writers now over bearish, trend followers that they are.
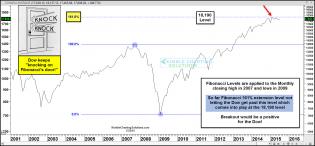
dowknockingonfib161doorjuly231.jpg (1571×733)
Key Fibonacci level on the Dow
1
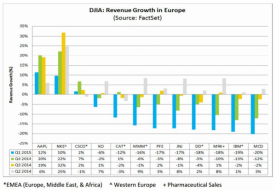
djia.revs
Dow component revenues in Europe, in the dumps as of end of Q1.
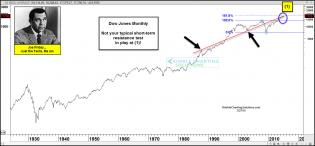
joefridaydowlongtermnottypicalpricetestmar27.jpg (1569×732)
Very long term Dow
indicators
Public is now brazen in its over bullishness.
hyg
Risk is 'ON', and that is the point. Weeks ago we posted risk 'ON' (see post this chart goes w/ if you want) when...
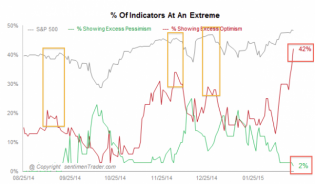
indicators
Sentiment is extreme and Risk vs. Reward flat out sucks.
2
hyg
Junk bonds not negatively diverging stocks. Sentiment is over bullish, but technicals on indexes are good. Watch...
1
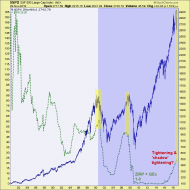
Dow In monthly.png
Is the Dow Industrials at a long term major top?
Of course no one really knows the answer to that but this chart...

dowmegaphonefibextensionbreakoutdec22.jpg (1572×735)
Megaphone pattern on the Dow
1
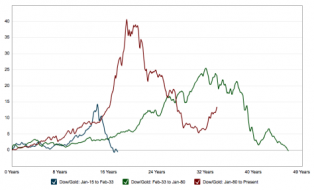
dow.gold
Dow vs. Gold historical from Macro Trends. New secular bull in stocks vs. gold or just an in-cycle counter trend?...
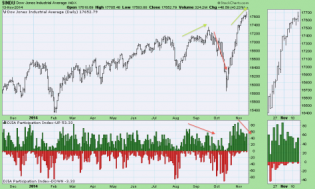
indu.part
Dow participation index is fading, just like pre-Oct.
DIA-daily-Oct1.jpg
I’m tracking four Oct 10 167/169 put spreads for a 0.05 CREDIT, based on subscriber feedback left in the chat ro...

2
aaii
Individual investors are sucking the hook on the recovery rally.
indu
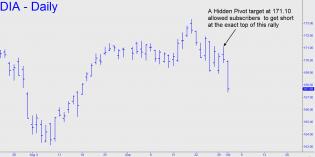
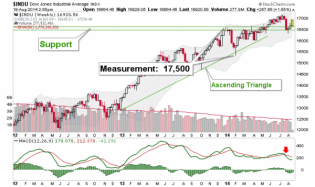
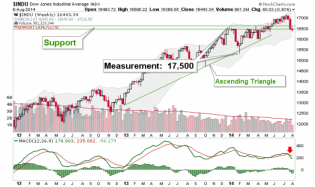
I was a bit embarrassed of this chart a couple weeks ago. Now? Not so much. Target is 17,500 above Symmetrical...
dow
Dow Ascending tri in trouble.
fund.cash
Mutual fund cash levels anemic. This is a necessary ingredient for a top, but not a timing tool.
5
indu.spx
Dow & SPX bounce @ MA 50's per post at site yesterday http://biiwii.com/wordpress/2014/05/15/dow-now-time/ That's...
dowmegaphonelookalikesvaluationsdifferentapr7.jpg (1571×734)
2
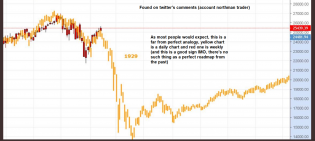
spx
Near perfect similarity to 2007 on SP500 weekly chart. Now, will it flop like the damn 1929 Crash analog?
3
dia
DIA at resistance, volume lame.
1
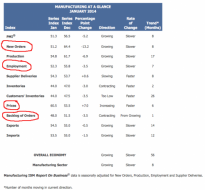
ism
ISM new orders, employment and backlogs down, price up... WAY up. Not good, say hello to the macro pivot phase fo...