Browse Symbol Stacks: $DJI
slopechart_$DJI.jpg
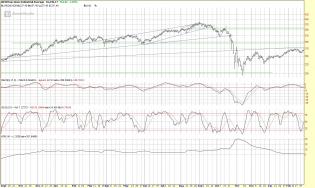
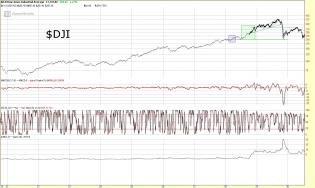
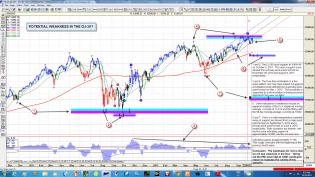
Dow Fib levels plus Hunter insanity square

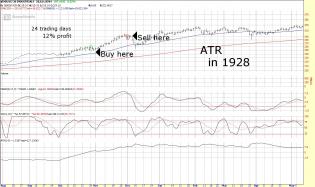
ATR1928.jpg
Nothing new under the sun. These are the kind of markets where ATR shines. If you want a precedent from history,...

3
blog.kimblechartingsolutio...-june-7-2.jpg
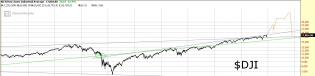
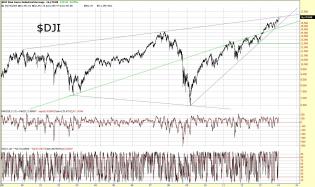
Dow continues to find support above it's long term breakout.
1
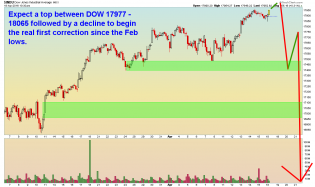
DOW - 1 hour - 4.18.16.png
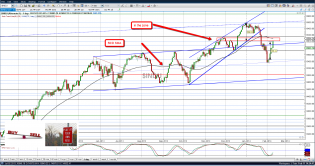
DOW, 1 hour chart. This is not investment advice.

2
content.screencast.com/use...%20Update.jpg
Analog Update
1
content.screencast.com/use...b2bd/1929.jpg
1929 DJI
blog.kimblechartingsolutio...angeaug18.jpg
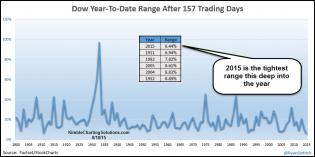
After 157 trading days in 2015, the Dow has traded in a range of just 6.44%. This was derived using a closing bas...
2
content.screencast.com/use...928Update.jpg
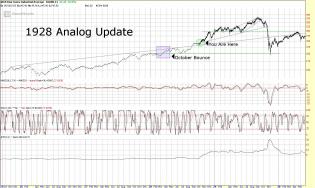
1928 Analog Update
content.screencast.com/use...928Analog.jpg
Since I'm bored this weekend, and really like charts... I went ahead and put together rough outline of what a 1928...
1
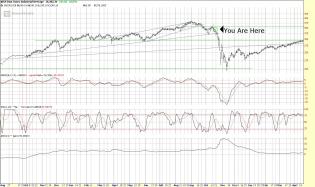
content.screencast.com/use...d/DJI1928.jpg
Are we here?
The previous record for consecutive days above the 5DMA is show in the purple box. What followed...
DJIA.png
$DJI in the zone scaling into shorts

1

Encore.JPG
3
content.screencast.com/use...DJI122613.jpg
Take a wild guess what today's buying frenzy in the DJI led to? Yep, you guessed it. Trendline touch of the 13 y...
3
content.screencast.com/use...DJI101913.gif
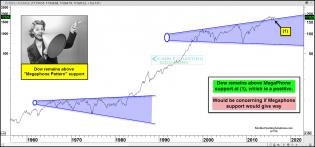
A long term look at the $DJI over the past 30 years. We currently find ourselves at the top of a 14 year megaphon...
content.screencast.com/use...1929Drop1.gif
A 6.5% drop you say TK?
Here's a little taste of an upcoming Rev 1929 analog post. See if this chart looks fam...
2
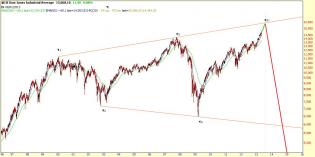
DJI megaphone pattern
Is this the biggest developing megaphone ever -- $DJI?

3
content.screencast.com/use...epression.gif
Not saying it's going to happen, but just pointing out that if we had another Great Depression-type fall in the ma...
2
content.screencast.com/use.../DJI22013.gif
$DJI bear porn thesis.
content.screencast.com/use.../DJI11313.gif
DJI 2 yr Daily Chart
If...If this is going to pan out, here's what I see.
1. Since breaking out of its...
content.screencast.com/use...DJI122912.gif
Long Term 40 yr DJI Monthly Chart
Notice the negative MACD divergences even on the monthly chart, combined wi...
1
content.screencast.com/use...DJI122812.gif
$DJI backtest has been a thing of beauty. A heavy selloff into late Jan/early Feb is a high possibility from here, IMO.
DJ-30.jpg
