Browse Symbol Stacks: OIL
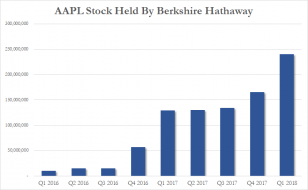
2018.05.04charts.png (740×456)
TGIF -- all those bottles look like Oil and Vinegar Bar

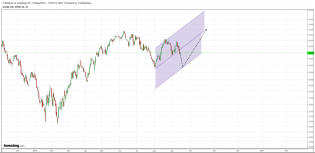
cl 15.09.16.png
oil first 39-40 then up into a channel

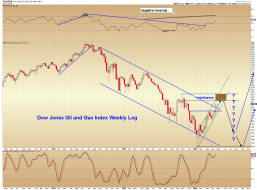
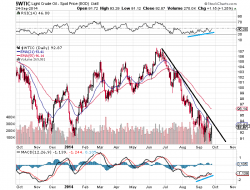
oil and gas weekly log.png
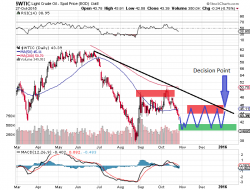
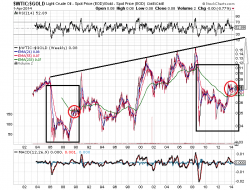
Oil and Gas weekly log chart with RSI: There has been a break this week of the long term downtrend line in this se...

3
fig1.png
2
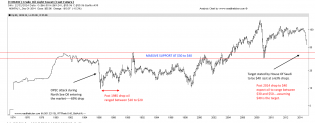
oil 15.1.16 longterm2.png
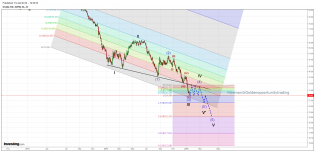
Oil: Current long-term view-prediction 2
1
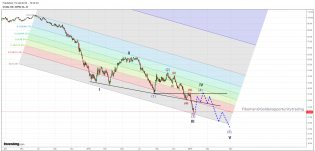
oil 15.1.16 long term1.png
Oil: Current long-term view-prediction 1
1
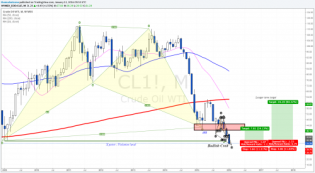
Update - Monthly pattern challenged, daily Crab... • The Market Zone
Monthly harmonic pattern challenged

oil 6.1.16.png
oil3.png
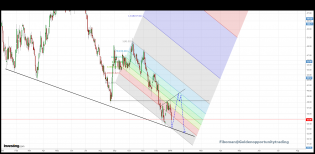
Oil update: Approaching a short term reversal point
1
sc376.png
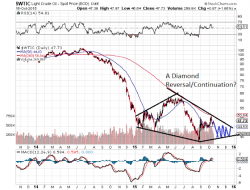
Oil is probably forming a diamond: Reversal or Continuation?
3
sc348.png
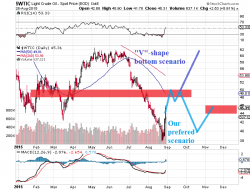
Are better days coming for oil? 2 possible scenarios.
2
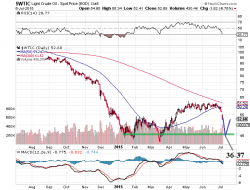
sc338.png
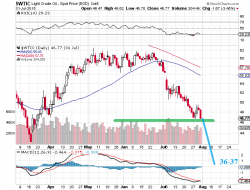
Below 46 Oil will move towards 36-37
2
sc331.png
oil towards 46$
4

USO03252015.png
Looks like Yemen attacks are saving crude from weakness short term. No position here, just offering a $USO chart.

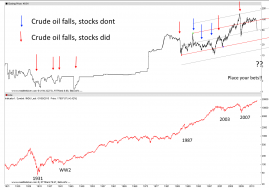
crude vs dow
Crude oil vs Dow Jones

OIL
oil
2
sc193.png
Oil ready for a bounce?
1
sc186.png
If I had oil, what would it be cheap to buy??
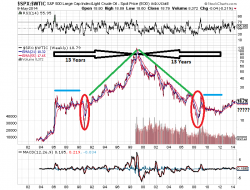
And the answer is... Bonds and maybe after a correction equities!
1
sc (66).png
Symmetry or someone doesn't play dice with charts...
3
central-bank-gold-sales-purchases.jpg
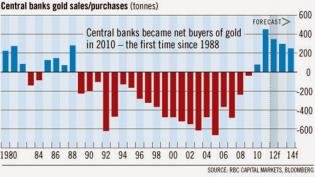
Is this chart has anything to do with the price of oil?
http://goldenopportunitytrading.blogspot.co.uk/2014/04/is-go...
3
sc (26).png
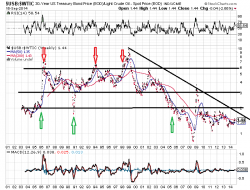
What oil (priced in gold ounces) is trying to tell us about itself and probably about international relations
http...
2
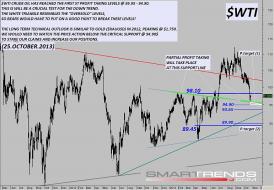
NYMEX_25_10_2013.jpg
$WTI CRUDE OIL, WATCH OUT FOR THESE LEVELS

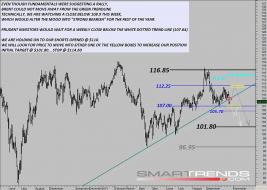
BRENT_24_10_2013.jpg
Throughout 2013, Brent Oil has been "rebounding", but not "trending". We will be shorting the market, with the fol...
1
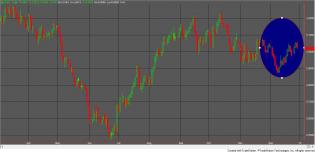
heating oil futures.jpg
watch the inverse head and shoulder in heating oil futures could be a nice pay out
