Browse Symbol Stacks: SMH: sox

sox

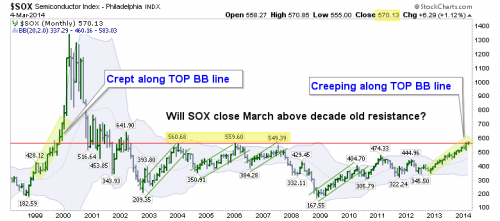
Look at this chart very carefully. Blow it up if you have to. Note what SOX is doing at the top BB vs. what it did pre-market blow off in 1999. Also note that it is at new 10 year highs but must close March that way to confirm breakout.

Comments

rayman29rayman29
jackwad 3/5/14
Booboo, Degrowth Defined →Booboo, Degrowth Defined →
Why would a breakout not confirm? ALL IS WELL! 3/5/14
NFTRHNFTRH
Jackwad yourself... clown. 3/5/14
DinkDink
I've looked at the SOX a bunch recently and let me tell you what I see. I see a potential major 10+ year base. The problem is too many people are noticing this base, which means it is unlikely that it will have a true breakout up here on the first try. Another issue is that the earlier breakout above $450, which led to this trending move, has not been retested in bullish fashion. My guess is we need to retest $400-$450 before breaking above $600. 3/5/14
NFTRHNFTRH
Very possible Dink. But what I find most interesting is the creeping along the top BB, like in 1999. Not really sure about whether what everyone sees matters in this market. So the point of the chart is that it fits with a stock mania scenario if the breakout does hold. 3/5/14
DinkDink
Lucifer help us all if that happens. 3/5/14
...