Browse Symbol Stacks: $WDAY: Workday.jpg
Workday.jpg
Question on best practice. Have drawn a couple of black lines on Ryan Mallory's Workday idea. One line goes through the top of the wicks on the candles on the inverse head and shoulders. The other goes through the bottom of the wick of those same candles. I notice that Ryan drew a declining trendline through the latter candles only ignoring the trendlines that I drew. The first question is: 'Why is the declinding trendline better?'. The second question is: 'Is this a failed breakout or is it still pushing through resistance?'. My top trendline suggests it has just hit the underside of the trendline after a failed breakout. My second trendline was tested and price is still working its way through resistance. Which is it? Or is it both? Also I note that volume has dropped off and it looks like resistance is not being challenged by buyers. Also MACD is indicating that upward price movement is cooling off. Over to you.
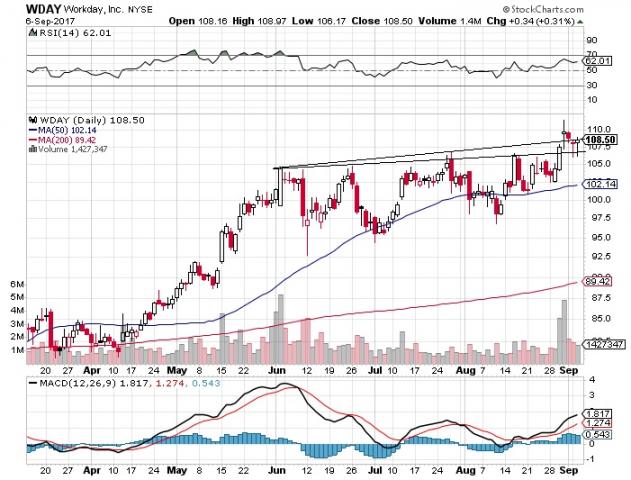


IMO if you want to trade on charts like this you have to look at the different lines, pick the set you think is the highest probability trade, and then structure the trade accordingly. 9/6/17