Browse Symbol Stacks: XLF: xlf weekly 3.6.14sc.png
xlf weekly 3.6.14sc.png
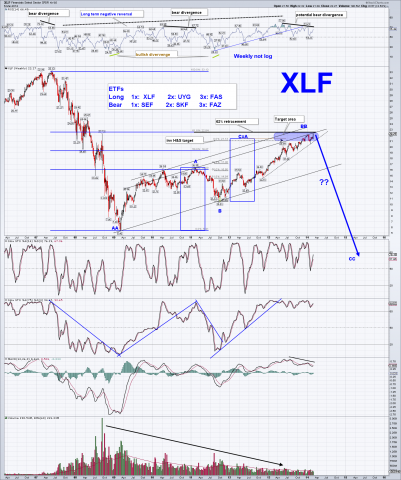
For longer term traders you may be interested in following XLF. This is a f/u of a weekly chart I posted on 8/10/13. I have not changed the target zone since that time. We have a negative divergence and a potential bearish divergence in the RSI. Together these often lead to an intermediate trend reversal. Despite the advance in price the volume has remained low and we are almost at a 62% retracement. No guarantees in this crazy bull market but seems like good chance of a reversal soon. But best to wait for a "sign" (ie favorable candlestick formation or trend line break) Best to ya. Tom B
Comments
 zstock
