Browse Symbol Stacks: XLF
slopechart_XLF,KRE.jpg
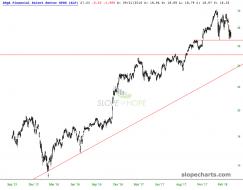
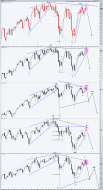
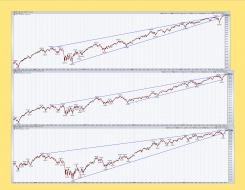
XLF vs KRE

1
slopechart_XLF.jpg
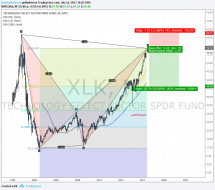
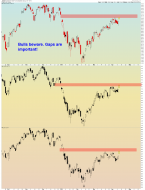
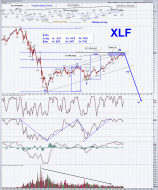
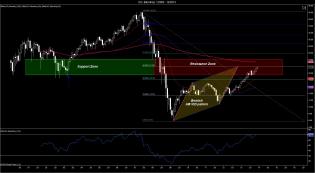
XLF - Broken support, then solid-as-you-please backtest of lower red dashed trendline.
The Ichimoku Cloud lines c...

1
slopechart_XLF.jpg
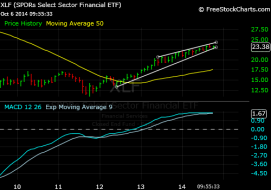
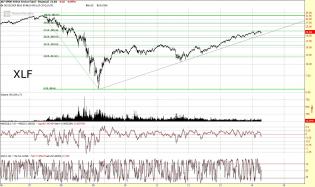
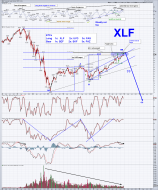
XLF rocket, just keeps going
slopechart_XLF.jpg
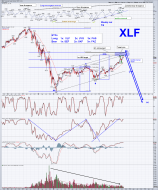
XLF short term
slopechart_XLF.jpg
failing the red dashed TL retest from below
2
slopechart_XLF.jpg

slopechart_XLF.jpg
looking shaky
slopechart_XLF.jpg
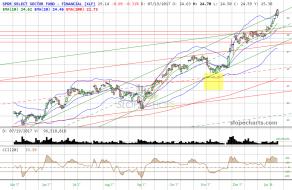
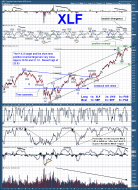
Amazing strength, is it nearing exhaustion, or does it have room to run?
3
slopechart_XLF.jpg
still on top of the trendline - can it hold?
2
slopechart_XLF.jpg
frothy
slopechart_XLF.jpg
Slope version
1
slopechart_XLF.jpg
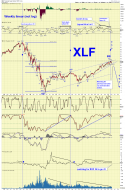
Monthly XLF.
Breakdown after breakdown. Now looking at the blues.
If the 2009 green doesn't hold, I'd expect th...
3
slopechart_XLF.jpg
in the news
slopechart_XLF.jpg
XLF - Purple reigns.
Bull above, Bear below.
1
bank stocks above 200 DMA.jpg (586×449)

slopechart_XLF.jpg
XLF at ATH, just before bank earnings
slopechart_GS,JPM,BAC,C,XLF.jpg
slopechart_XLF.jpg
Driftless

slopechart_XLF/FR:DTWEXBGS.jpg
Here's an odd look at the financials ETF (XLF) plotted against the U.S. Trade-Weighted Dollar.

slopechart_XLF.jpg
Financials since Election Day
Stock Market Sector Rotation Should Peak Within 60+ Days – Par...

xlf-financial-crisis-breakout-or-double-top-nov-12.jpg (1552×822)
1
slopechart_GS.jpg
That didn't take Very Long
$XLF
https://www.investing.com/etfs/financial-select-sector-spdr-fund

5
slopechart_HAO.jpg
See https://slopeofhope.com/page/social-trade.html#activity
@MS deleted posts! LOL Let's see who is more stubborn...
1
slopechart_HAO.jpg
See https://slopeofhope.com/page/social-trade.html#activity
@MS deleted posts! LOL
""""Nice little EOD Ramp!""...
1
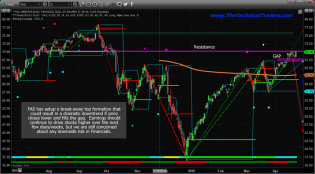
Financials Setting Up An Island Top Formation – Technical Traders Ltd.
xlf-spy-and-eufn-xlf-ratios-contiune-to-send-negative-message-to-st...
1
slopechart_XLY.jpg
Thanks @Doom
WTF are angels? Are the angelic flock similar to ghosts? (I know, the nuns are going to ruler my h...
1
slopechart_XLF.jpg
One of my favorite analogs of all time.
slopechart_XLF.jpg
XLF matters

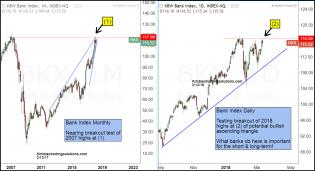
bank-index-testing-2007-highs-march-13.jpg (1229×671)
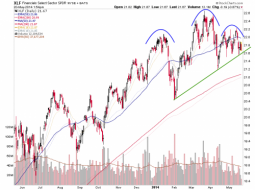
Bank Index- Testing 2007 level, breakout or double top?

slopechart_XLF (2).jpg
$XLF and see $GS and $BAC reporting this am.
2
slopechart_XLF (1).jpg
$XLF reporting tomorrow
2
Weekly Markets Anlaysis
SPY - Broadening Top, Bollinger Bands, RSI - All signs indicate that we won't see Year End Rally this year... but!

weekly markets analysis
Bearish harmonic patterns in two sectors. What it means for SPX?
1
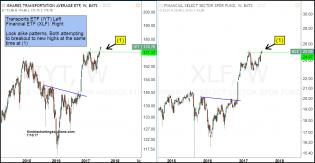
transports-and-financials-attempting-dual-breakouts-july-12.jpg...
This is good news for investors, as this could signal a fresh leg higher for stocks. Today, I’d like to zoom in...
1
Click to enlarge
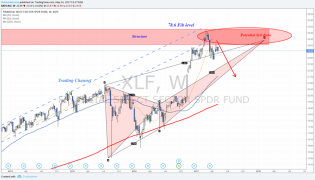
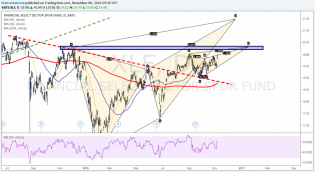
Weekly Markets Analysis - Gartley pattern in SPY and Crab pattern in XLF
3
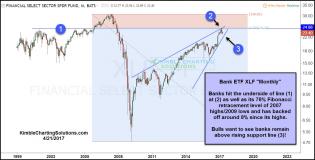
xlf-backing-off-after-hitting-fib-resistance-level-april-21.jpg...
Regional and Large banks have done well since the election. Of late they have lagged the broad market and find the...
2
4 feb15.PNG
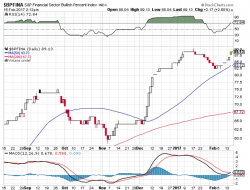
back around 90% bulls in financials

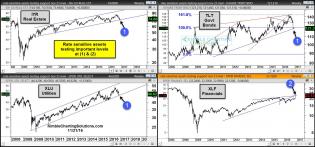
rate-sensitive-4-pack-testing-support-nov-21.jpg (1567×736)
Rate-sensitive assets
2
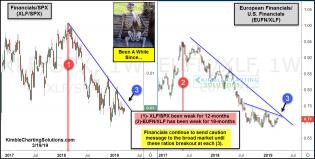
XLF analysis
Special markets review towards the U.S elections
1
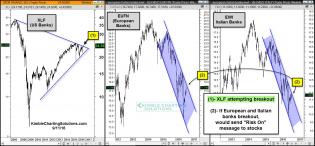
xlf-eufn-ewi-attempting-breakouts-sept-1.jpg (1565×729)
Banks around the world
3

XLF - Daily - 8.17.16.png
XLF - daily chart. This is not investment advice.

1
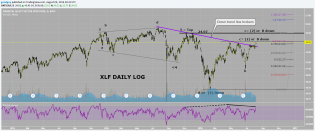
XLF DAILY LOG.png
This bear is still holding on. (at least for a little while longer). Here is a chart of XLF in where a down trend...

1
XLF - Daily - 8.5.16.png
XLF - daily. Bears had their chance and they blew it. This is not investment advice.
13
2 jul25.PNG
3
Update on financials XLF.png
2 months ago I posted on XLF suggesting the top was likely in (see previous post). As I review the price action is m...
Weekly canles suggest more downside ahead.png
Notice the weekly candle formation for some of the major indices. This is also my current view of what I see as a...
1
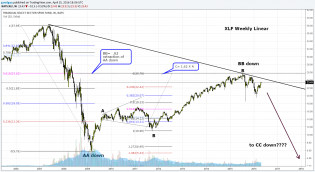
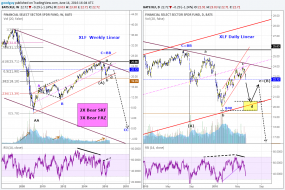
XLF Weekly Fib.png
XLF weekly linear Interesting Fibonacci relationships the way I see it. In EWT B waves not infrequently are tr...
1
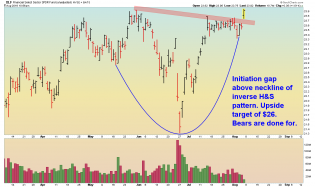
Finances.png
Financials (XLF) is currently filling a gap so I feel like I'm going out on a bit of a limb here saying that the g...

1
XLF daily log..png
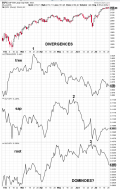
Intermarket - Daily - 4.13.16.png
Intermarket. Daily chart. Market is likely about to top. This is not investment advice.
1
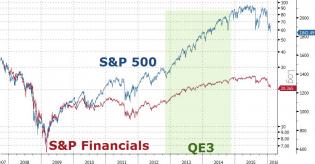
20160211_usbanks2.jpg (951×475)
Bank stocks have some catching-down to do
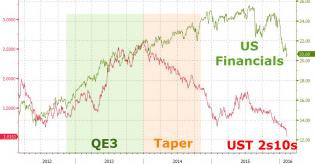
20160210_2s10s2.jpg (959×500)
Financials getting pulled lower by collapsing interest rates
2
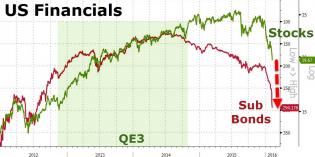
20160208_financials.jpg (962×501)
Either Banks Are Cheap... Or The Market's Gonna Crash
3

XLF_Weekly_Fibs_Oct262015.jpg
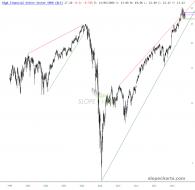
Will the BIG banks lead us lower?
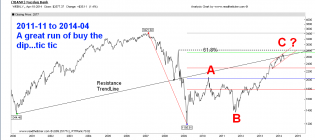
Back in July, the XLF weekly chart rose to within 20-cents of its 61.8% retracem...

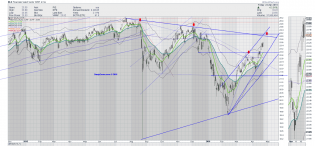
log SPY QQQ XLF.jpg
When I first became interested in stock analysis I noticed sometimes there was what I called "the low before THE h...
1
cdn.socialtrade.com/comsys..._3A7izi_m.png
Financials in a wedge on 2-year support.

Snapshot 6.24 daily candlessc.png
Daily charts. A lot of reversal and shooting star type candles here today. Should be good to bearish types for...
xlf
Financials ugly pattern, just above severely up-sloped neckline. A break of neckline look out below.

3
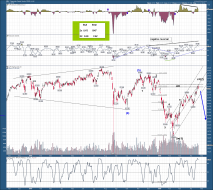
XLF weekly sc.png
Weekly XLF non-log chart: Is XLF set up for a fall? Always a dangerous call in this market. But the set up seems r...
2
content.screencast.com/use.../XLF42114.jpg
Did someone say short financials? XLF struggling with it's 61.8 fib, and large 5 year cyclical bull move is tired...

NAS bank
XLF

xlf weekly 3.6.14sc.png
For longer term traders you may be interested in following XLF. This is a f/u of a weekly chart I posted on 8/10/...
1
$XLF Financial Select Sector SPDR stock and investing informatio...
Monthly bearish harmonic trading pattern in $XLF - 2014 technical analysis forecast http://prezi.com/psbtboky4d3x/the...
1
XLF weekly12.22.13sc.png
XLF weekly. This is a f/u from the chart I posted on 8/10 when XLF was 20.42. It hasn't gone up much in >3 months...
2
XLF daily sc.png
See weekly chart.
XLF Weekly sc.png
XLF is one ETF with a lot of +/- “daughter” EFTs at 1x, 2x, and 3x that I watch. I think it is very likely at...
financialthirdtimebangingjan8.gif (1559×689)
Financials ETF (XLF) almost doubled the performance of the S&P 500 index in 2012. Can this white hot sector contin...
1

Chart

![6e164d0dde087d4679c5a49c05f9e[1].jpg](https://s3.amazonaws.com/cdn2.socialtrade.com/st/shards/1374_SE8aGoE4_h)
6e164d0dde087d4679c5a49c05f9e[1].jpg
XLF Financials Long
A Diamond to Take Down the Financials?

1
http://i657.photobucket.com/albums/uu293/bigelkhorn/fghu.jpg


non-sequiter-1-27-08.gif
The smartest escape