User: Tim Knight: Prediction Fails
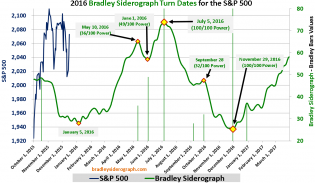
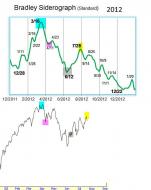
2016+S%26P+500+Bradley+Siderograph+Turn+Dates+Large+%282015-12-16%2...
For the zillionth year in a row, the Bradley graph offered ZERO predictive utility.

3
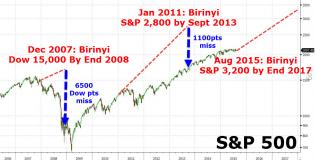
20150804_brinyi1.jpg (1189×605)
Laszlo Birinyi has a very broken crystal ball, it seems. What a dork.
3
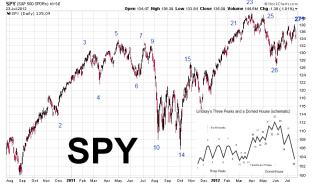
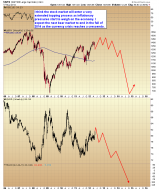
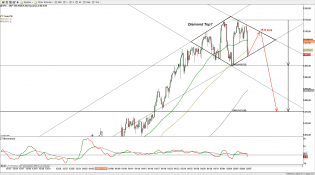
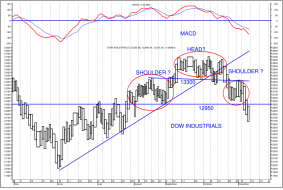
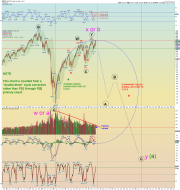
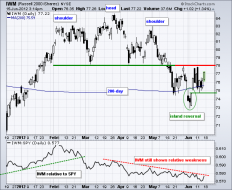
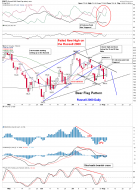
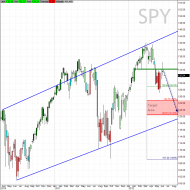
SPY Three Peaks and a Domed House July 2012.jpg

13
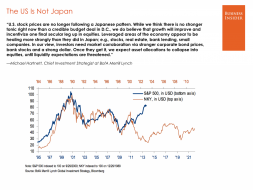
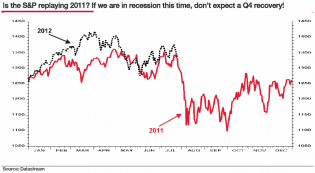
MOST IMPORTANT CHARTS IN THE WORLD Q4 - Business Insider
This is a pretty stunning example of how an analog can be breathtakingly great and then suddenly fall to pieces
3
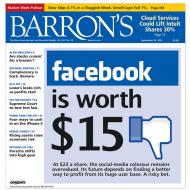
ON-AY643_cover0_KS_20120922014840.jpg (800×800)
Barron's blew this one
7
Smart Money Tracker: MAJOR LONG-TERM BOTTOMS FORMING IN GOLD AND...
Total fail on this prediction
2
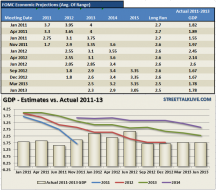
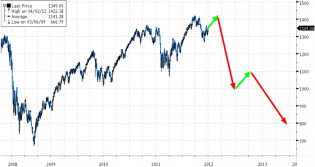
Fed-Revisions-GDP-061913.PNG (664×582)
Fed's Economic Projections - Myth Vs. Reality
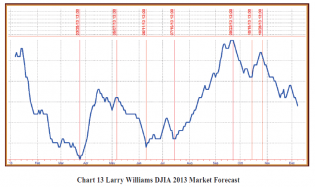
1230-larryforecast.png
4
0724-bradley.jpg
The Bradley was completely and utterly useless.
13
20130207-SPX-4.png (1920×1072)
2
20120629_janjuah.png (720×383)
2
![Rich Man's Panic of 1907 [General] - MarketTicker Forums](https://s3.amazonaws.com/cdn2.socialtrade.com/st/shards/8077_8nQIwGzd_h)
Rich Man's Panic of 1907 [General] - MarketTicker Forums
Here's a great example of a completely failed analog. It was convincing at the time, though, wasn't it?
![b5794d737c08722d09c3944ee9687[1].jpg](https://s3.amazonaws.com/cdn2.socialtrade.com/st/shards/1375_Gy3f6xMR_h)
b5794d737c08722d09c3944ee9687[1].jpg

5
Arms-HS.png (919×616)
FF
6
http://www.321gold.com/editorials/sfs/hubbartt072012/gold_2012.gif

usd_triangle.gif (670×838)
1
sc 1,550×1,634 pixels

5
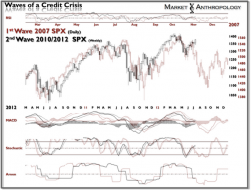
Market Anthropology: the Game

2
BHP7112 - tnrevolution's library

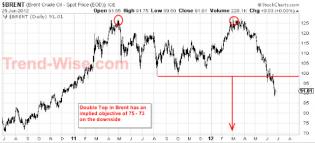
Trend-Wise
2
120615iwmcww

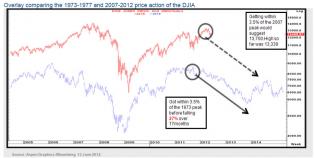
0621-1973analog.jpg
gdx_breakout.gif (670×838)
1
http://www.321gold.com/editorials/sfs/hubbartt062212/silver.gif
2
dshort Featured Charts
1
content.screencast.com/use...0/RUT8512.gif
1
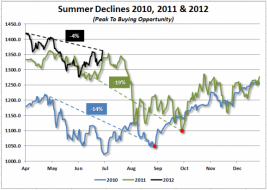
Summer Declines

2
sc (990×1357)
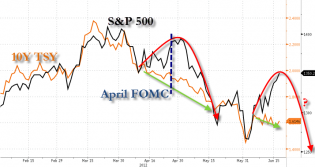
20120619_FOMC.png (714×380)
2

2012-08-07_1124 - chartwiz's library

6
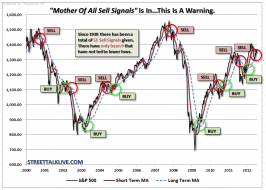
20120725_sell.png

5
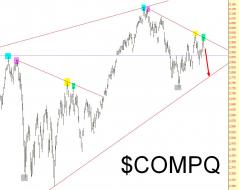
0723-compqanalog.jpg
20120725_plunge.png
5
bluechip bulldog: SPY Targets on Weekly Chart
3
astro_2at_03_mars_uranus_opposition__crash_aspect_.27782.8182.gif
3