Log In
|
Create Account
Chart
AI Chart Analysis
Chart Lab
Drawn Objects ➟
Earnings Reactions
Guide to Patterns ➟
Modes ➟
Power Features ➟
Rotation Graphs
SlopeCharts
Yield Curve
Equities
Biggest Stocks
Calendar of Earnings
Correlations
Earnings ➟
Historical Earnings
Market Capitalization
Power Screener
Super Summary
Volume/Price Leaders
Woulda Shoulda
Markets
CryptoStream LIVE
Economic Database
Global Economics
Heatmap
Macroeconomics
Market Meter
MetaSymbols
Quad Matrix
SlopeRules
Watch Lists
Options
Analytics ➟
Backtest Strategies
Earnings Calendar
Extreme Options
Historical Charts
Matrix of Volatility
Open Interest & Volume
Payoff Analyzer
Strategy Explorer
Volatility Calendar
Read
Automatic Reports
Best Posts of All Time
Books by Tim Knight
Guide to Comments
Latest Posts
Mobile Apps
Profile of Your Host
Recommended Books
Ticker Stripper
Trading Rules
Social
Browse Chart Database
Comments Search
Hall of Fame
Members Directory
Publishing/Subscribing
Recent Activity
Search SlopeRules
Shared Labels & Lists
SlopeTalk LIVE
Trader’s Diary
Help
Best Pages for You
Charts Overview
Guide to the Site
Membership Levels
Pattern Video Library
Power Screener Guide
Premium Memberships
SlopeCharts Reference
SlopeCharts Videos
Video Tutorial
Log In
Create Free Account
Memberships
View: 20120725_sell.png
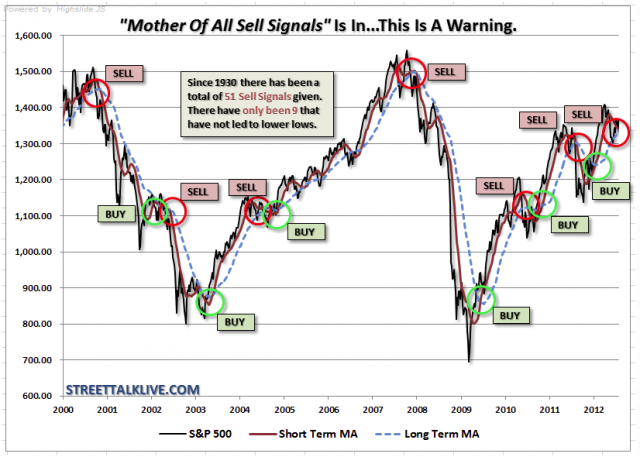
20120725_sell.png
Restack of
20120725_sell.png
added by
yugobiz
.
Comments
Adam Green
Is this just an advertisement for the referenced site?
What's the chart? It must be more than MA crossovers (it ignores some of the crossovers) so I presume there's some rule or logic behind the "assertions" of buy/sell.
7/25/12
Sanddollar
Its a 50 200 MA and doctored. No signal since Jan and not close to giving one now.
8/18/12
Tim Knight
Another predictive flop.
9/1/12
Smoketrail
Not helpful, should be culled out of stack
9/1/12
Tim
The author says only 9 out of 51 sell signals worked - agreeing with this as a useless indicator
9/1/12
...
Actions
Tweet
Facebook
Stacks
Analogs
Predictions
Prediction Fails
Restacked
By:
Tim Knight
On: 9/1/12 5:27AM
Posted
By:
yugobiz
On: 7/25/12 3:05PM
Statistics
Viewed by 159 SocialTraders
Average rating based on 7 responses:
Rated By
Restacked By


What's the chart? It must be more than MA crossovers (it ignores some of the crossovers) so I presume there's some rule or logic behind the "assertions" of buy/sell. 7/25/12